
Types of Financial Statements
Financial statements are essential tools for analyzing a company’s financial performance and making informed business decisions. There are three main types of financial statements:
1. Balance Sheet
The balance sheet provides a snapshot of a company’s financial position at a specific point in time. It presents the company’s assets, liabilities, and shareholders’ equity. Assets include cash, inventory, property, and equipment, while liabilities encompass debts and obligations. Shareholders’ equity represents the net worth of the company, calculated by subtracting liabilities from assets. The balance sheet helps investors and analysts assess a company’s solvency and financial stability.
2. Income Statement
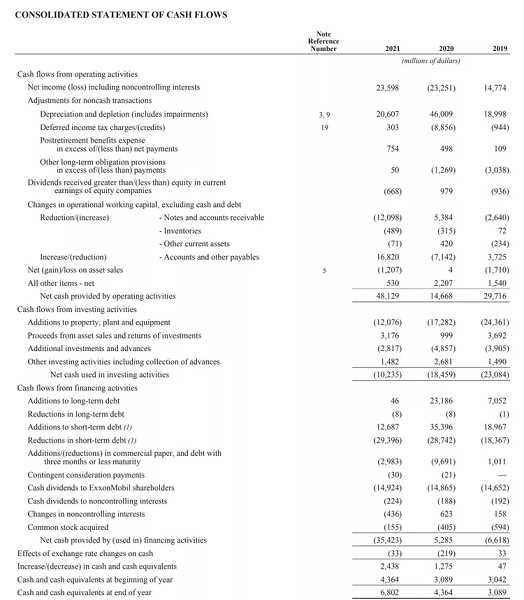
3. Cash Flow Statement

The cash flow statement tracks the inflow and outflow of cash within a company during a given period. It categorizes cash flows into three main activities: operating, investing, and financing. Operating activities include cash generated from day-to-day operations, such as sales and expenses. Investing activities involve cash flows from buying or selling assets, such as property or equipment. Financing activities include cash flows from borrowing or repaying loans, issuing or buying back shares, and paying dividends. The cash flow statement helps assess a company’s liquidity and ability to meet its financial obligations.
Balance Sheet: Analyzing a Company’s Financial Position
A balance sheet is one of the three main financial statements used by investors, analysts, and creditors to assess a company’s financial position. It provides a snapshot of a company’s assets, liabilities, and shareholders’ equity at a specific point in time.
A balance sheet is divided into three main sections: assets, liabilities, and shareholders’ equity.
- Assets: Assets represent what a company owns and include items such as cash, accounts receivable, inventory, property, and equipment. These are resources that the company can use to generate revenue.
- Liabilities: Liabilities represent what a company owes to others, such as loans, accounts payable, and accrued expenses. These are obligations that the company needs to fulfill.
- Shareholders’ Equity: Shareholders’ equity represents the residual interest in the company’s assets after deducting liabilities. It includes items such as retained earnings and contributed capital.
Interpreting a Balance Sheet
When analyzing a balance sheet, there are several key ratios and metrics that can provide insights into a company’s financial health:
- Current Ratio: This ratio measures a company’s ability to meet its short-term obligations. It is calculated by dividing current assets by current liabilities. A higher current ratio indicates a better ability to cover short-term debts.
- Debt-to-Equity Ratio: This ratio compares a company’s total debt to its shareholders’ equity. It indicates the proportion of a company’s financing that comes from debt versus equity. A higher debt-to-equity ratio may indicate higher financial risk.
- Return on Equity (ROE): ROE measures a company’s profitability relative to its shareholders’ equity. It is calculated by dividing net income by shareholders’ equity. A higher ROE indicates better profitability.
Limitations of a Balance Sheet
While a balance sheet provides valuable information about a company’s financial position, it has some limitations:
- A balance sheet only provides a snapshot of a company’s financial position at a specific point in time and does not show changes over time.
- It relies on historical cost accounting, which may not reflect the current market value of assets and liabilities.
- It does not capture intangible assets, such as brand value or intellectual property, which can be significant for certain companies.
Despite these limitations, a balance sheet is an essential tool for investors and analysts to assess a company’s financial health and make informed decisions.
Income Statement: Evaluating a Company’s Profitability
Components of an Income Statement
An income statement typically consists of the following components:
- Revenue: This section includes the total amount of money generated from the sale of goods or services. It represents the company’s top line or gross income.
- Cost of Goods Sold (COGS): COGS refers to the direct costs associated with producing or delivering the goods or services sold. It includes the cost of raw materials, labor, and manufacturing overhead.
- Gross Profit: Gross profit is calculated by subtracting the COGS from the revenue. It represents the profit made from the core operations of the business.
- Operating Expenses: This section includes all the expenses incurred in running the day-to-day operations of the business, such as salaries, rent, utilities, and marketing expenses.
- Operating Income: Operating income is calculated by subtracting the operating expenses from the gross profit. It represents the profit generated from the core operations of the business before considering interest and taxes.
- Interest and Taxes: This section includes the interest expenses and taxes paid by the company.
Interpreting the Income Statement
The income statement provides valuable insights into a company’s profitability and financial health. By analyzing the various components of the income statement, investors can assess the company’s ability to generate profits, control costs, and manage its operations effectively.
Key metrics and ratios that can be derived from the income statement include:
- Gross Profit Margin: This ratio indicates the percentage of revenue that remains after deducting the cost of goods sold. A higher gross profit margin generally indicates better efficiency in managing production costs.
- Operating Margin: Operating margin measures the profitability of a company’s core operations. It is calculated by dividing the operating income by the revenue. A higher operating margin indicates better operational efficiency.
- Net Profit Margin: Net profit margin represents the percentage of revenue that remains as net income after deducting all expenses. It reflects the overall profitability of the company.
- Earnings per Share (EPS): EPS is calculated by dividing the net income by the number of outstanding shares. It indicates the amount of profit allocated to each share and is an important measure for investors.
By analyzing these metrics and comparing them to industry benchmarks and historical data, investors can gain insights into a company’s financial performance and make informed investment decisions.
Cash Flow Statement: Assessing a Company’s Liquidity
The cash flow statement is one of the three main financial statements that provide valuable insights into a company’s financial health. It focuses on the cash inflows and outflows during a specific period, helping investors and analysts assess a company’s liquidity.
What is a Cash Flow Statement?
A cash flow statement is a financial statement that shows the cash generated and used by a company during a particular period. It provides information about the cash inflows from operating activities, investing activities, and financing activities.
The cash flow statement is divided into three sections:
- Operating Activities: This section includes cash flows from the company’s core operations, such as revenue from sales and payments to suppliers and employees. It helps assess the company’s ability to generate cash from its day-to-day operations.
- Investing Activities: This section includes cash flows from buying or selling assets, such as property, plant, and equipment, or investments in other companies. It helps evaluate the company’s investment decisions and potential for future growth.
- Financing Activities: This section includes cash flows from raising capital, such as issuing stocks or bonds, or repaying debt. It provides insights into how the company finances its operations and expansion.
Why is the Cash Flow Statement Important?
The cash flow statement is crucial for several reasons:
- Assessing Liquidity: By analyzing the cash flow statement, investors and analysts can determine whether a company has enough cash to meet its short-term obligations. It helps assess the company’s liquidity and ability to weather financial challenges.
- Evaluating Cash Generation: The cash flow statement provides insights into a company’s ability to generate cash from its core operations. Positive cash flow from operating activities indicates a healthy business model.
- Identifying Cash Flow Issues: Negative cash flow from operating activities or excessive cash outflows from investing or financing activities may indicate potential financial problems or mismanagement.
- Supporting Investment Decisions: The cash flow statement helps investors evaluate the potential returns and risks associated with investing in a particular company. It provides a more comprehensive view of the company’s financial health than just the balance sheet or income statement.
Interpreting the Cash Flow Statement
When interpreting the cash flow statement, it is important to consider the following:
- Positive Cash Flow: Positive cash flow from operating activities indicates that the company is generating enough cash to cover its expenses and invest in growth opportunities.
- Negative Cash Flow: Negative cash flow from operating activities may indicate that the company is facing challenges in generating sufficient cash from its core operations. It could be a sign of declining sales, increasing costs, or poor management.
- Investing and Financing Activities: Analyzing the cash flows from investing and financing activities helps understand the company’s investment decisions and capital structure. Positive cash flows from investing activities may indicate growth and expansion, while negative cash flows from financing activities may indicate debt repayment or capital raising.

Emily Bibb simplifies finance through bestselling books and articles, bridging complex concepts for everyday understanding. Engaging audiences via social media, she shares insights for financial success. Active in seminars and philanthropy, Bibb aims to create a more financially informed society, driven by her passion for empowering others.