Tail Risk And The Odds Of Portfolio Losses

Exploring the Concept of Tail Risk One way to visualize tail risk is to imagine a bell curve representing the normal distribution of investment returns. The majority of returns fall within the middle of the curve, representing the expected range of outcomes. However, the tails of the curve represent the …

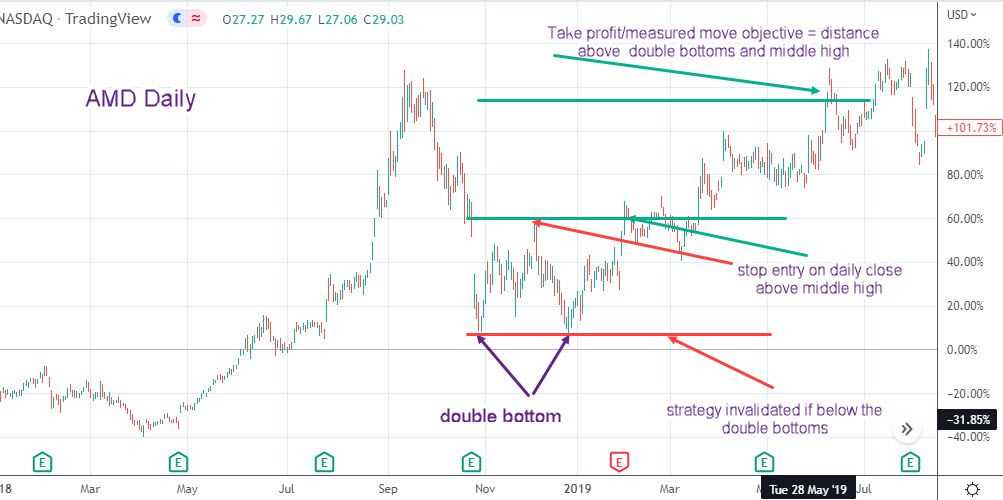
Double Bottom Patterns In Trading

What is a Double Bottom Pattern? A double bottom pattern is a technical analysis chart pattern that signals a potential reversal of a downtrend. It is formed when the price of an asset reaches a low point, bounces back up, and then falls again to a similar low point before …

Autoregressive Models: A Guide With Examples

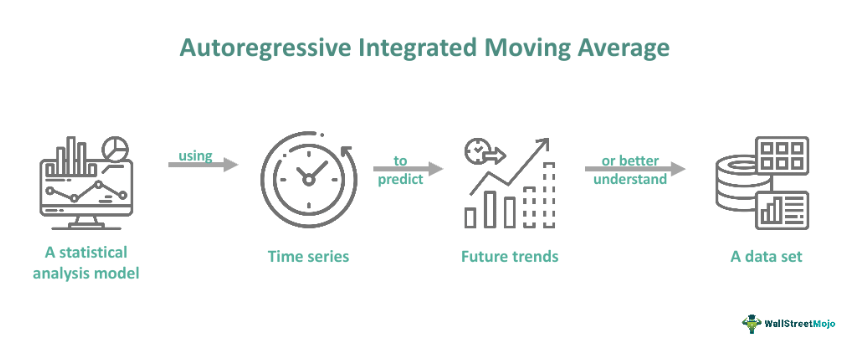
Applications of Autoregressive Models in Advanced Technical Analysis 1. Time Series Forecasting One of the primary applications of autoregressive models is in time series forecasting. By analyzing the historical data of a financial variable, such as stock prices or exchange rates, AR models can be used to predict future values. …

Data Smoothing – Definition, Uses and Methods

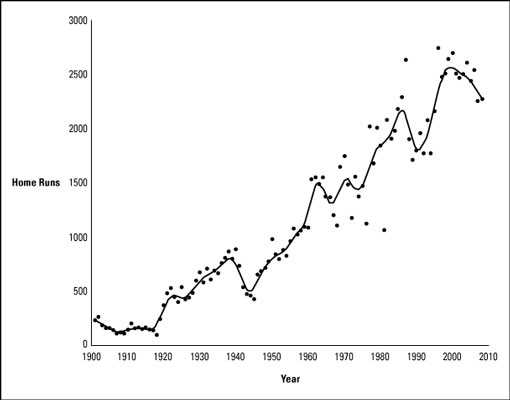
What is Data Smoothing? Data smoothing is a statistical technique used to remove noise or irregularities from a dataset in order to reveal underlying trends or patterns. It involves the application of mathematical algorithms to smooth out fluctuations and make the data more manageable and easier to analyze. Data smoothing …