Understanding the Uniform Distribution and its Applications

What is the Uniform Distribution? The uniform distribution is a probability distribution that describes a random variable with a continuous and uniform probability density function. In simpler terms, it is a distribution where all outcomes are equally likely. Characteristics of the Uniform Distribution There are a few key characteristics of …

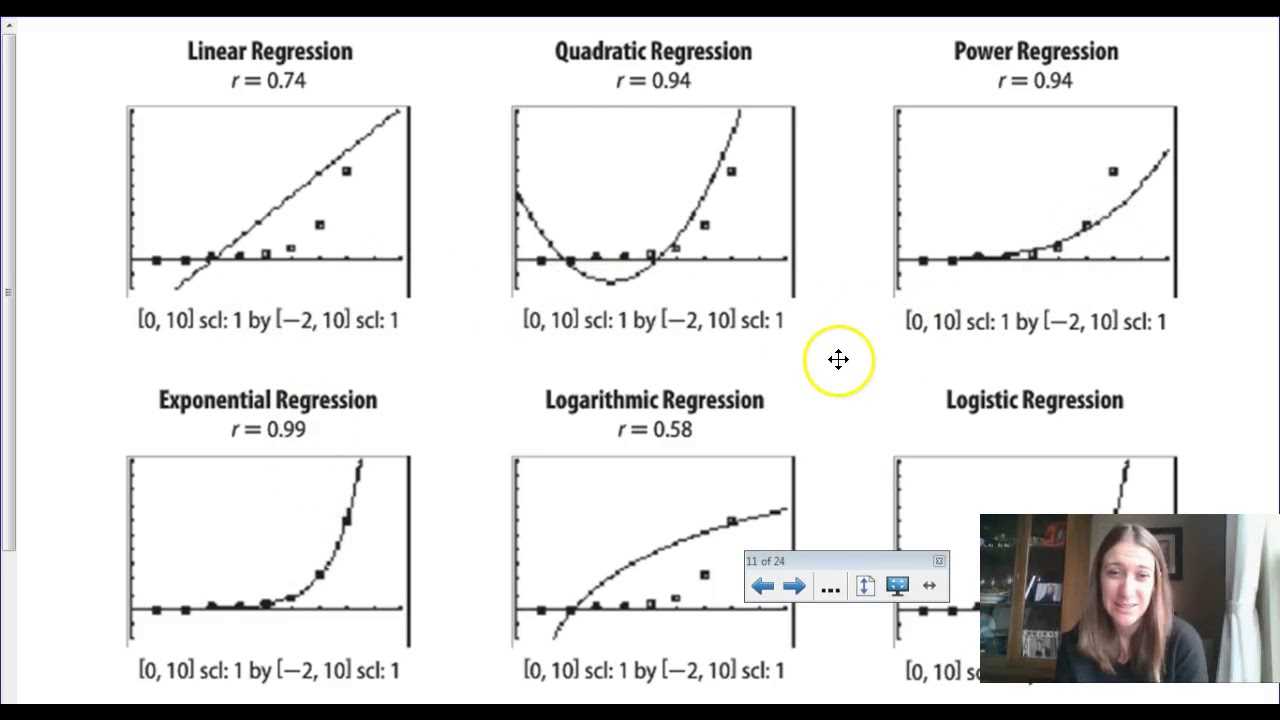
Nonlinear Regression: A Comparison To Linear Regression

A Comparison to Linear Regression In the field of statistics, regression analysis is a widely used technique for modeling the relationship between a dependent variable and one or more independent variables. Linear regression is one of the most common types of regression analysis, where the relationship between the variables is …

Understanding Mode in Statistics and Its Calculation Methods

Definition and Importance of Mode The mode is a statistical measure that represents the most frequently occurring value in a dataset. It is a simple and easy-to-understand concept that helps to summarize and analyze data. The mode is particularly useful when dealing with categorical or discrete data, where the values …

Unconditional Probability Overview and Examples

Unconditional Probability Overview and Examples To understand unconditional probability, it is important to grasp some basic concepts. First, we need to understand what a probability is. Probability is a measure of the likelihood of an event occurring. It is expressed as a number between 0 and 1, where 0 represents …

Type 1 Error: Definition, False Positives, and Examples

Type 1 Error: Definition When conducting a statistical test, researchers set a significance level, denoted as α (alpha), which represents the probability of making a Type 1 error. Typically, a significance level of 0.05 or 5% is used, meaning that there is a 5% chance of rejecting the null hypothesis …

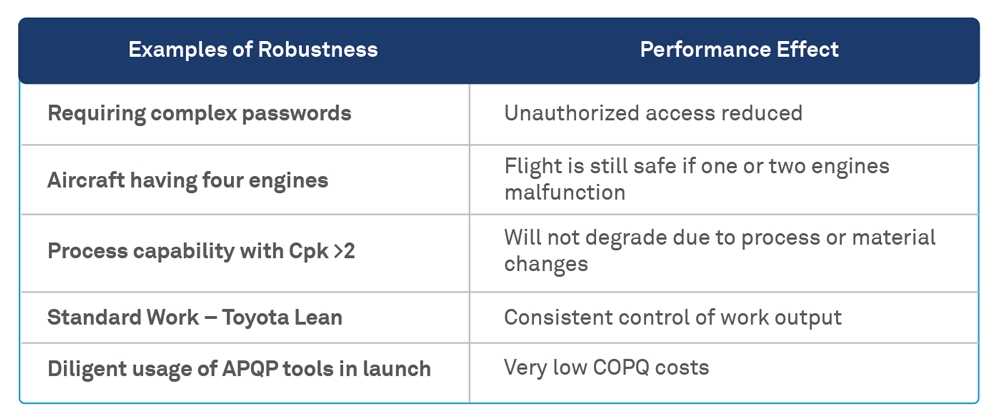
Robust – Definition, Functionality, and Real-life Examples

What is Robust? Robust is a term used in various fields, including mathematics, statistics, and computer science. In general, it refers to the ability of a system or method to perform well and maintain its functionality even in the presence of errors, uncertainties, or unexpected conditions. The concept of robustness …

Posterior Probability Definition Formula Calculation

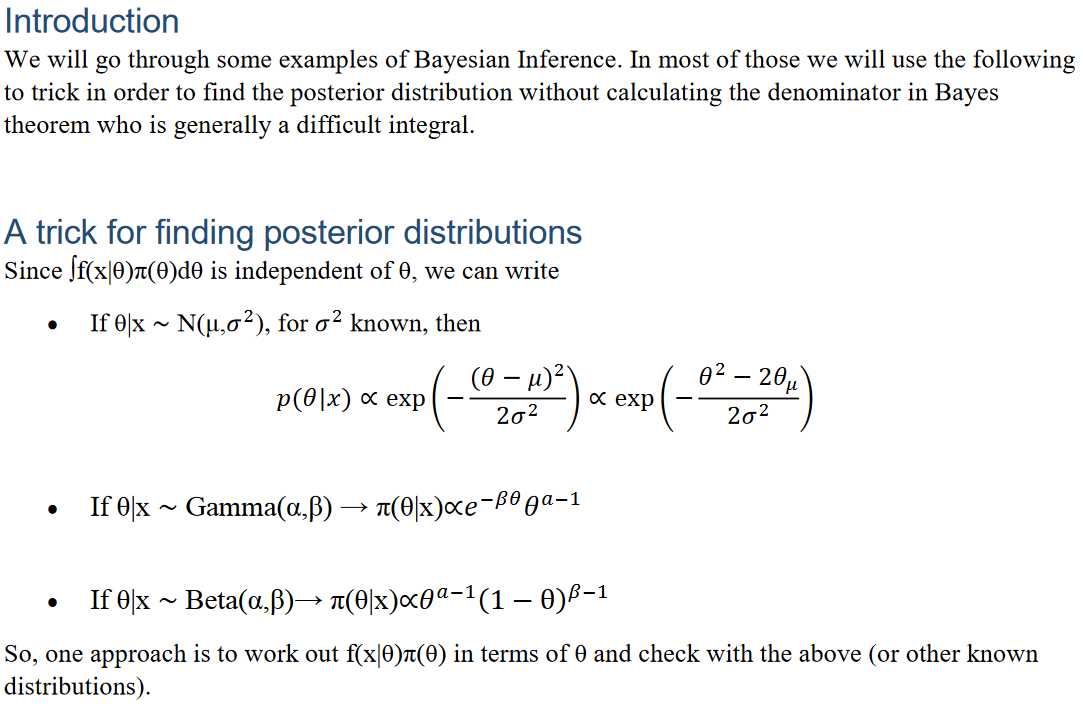
Posterior Probability: Definition, Formula, Calculation The posterior probability is a concept in mathematics and statistics that allows us to update our beliefs or knowledge about an event or hypothesis based on new evidence or data. It is an important tool in Bayesian statistics and is used in a wide range …

Poisson Distribution Formula and Meaning in Finance

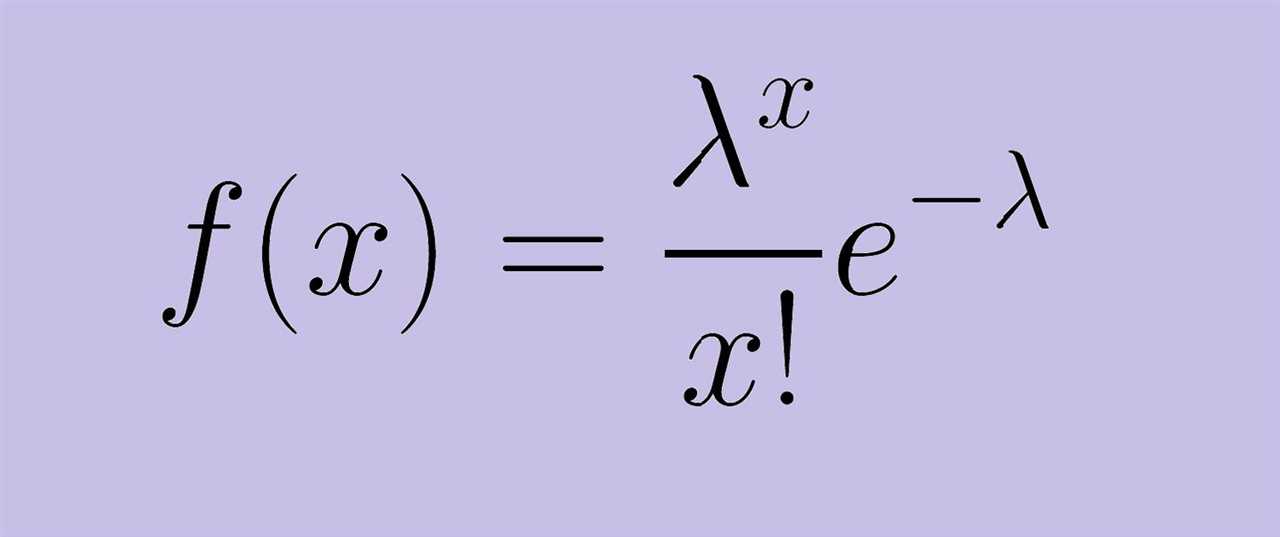
Poisson Distribution Formula and Meaning in Finance The Poisson distribution is a probability distribution that is often used in finance to model the occurrence of rare events. It is named after the French mathematician Siméon Denis Poisson, who first introduced the distribution in the early 19th century. The Poisson distribution …

Homoskedasticity In Regression Modeling: And Example

What is Homoskedasticity? Homoskedasticity is a term used in regression modeling to describe a situation where the variability of the errors, or residuals, is constant across all levels of the independent variables. In other words, it means that the spread of the residuals is the same for all values of …

Growth Curve: Definition, Usage, and Example

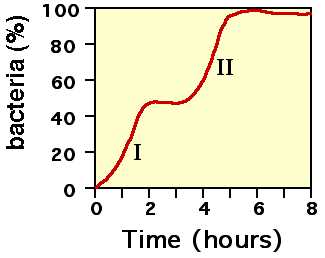
Growth Curve: Definition, Usage, and Example A growth curve is a mathematical model that represents how a particular variable changes over time. It is commonly used in various fields, including biology, economics, and psychology, to study and analyze the growth patterns of different phenomena. The concept of a growth curve …

Discrete Probability Distribution Overview and Examples

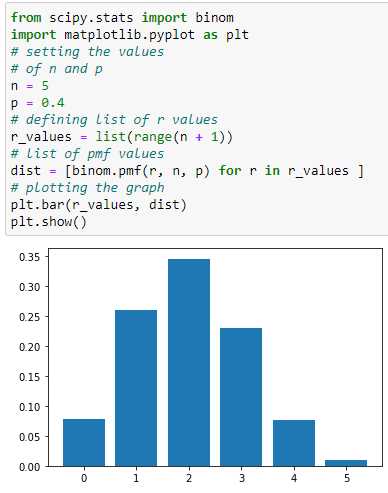
Discrete Probability Distribution Overview A discrete probability distribution is a statistical concept that describes the likelihood of different outcomes in a discrete random variable. Unlike continuous probability distributions, which deal with continuous random variables, discrete probability distributions deal with variables that can only take on a finite or countable number …

Chi-Square Statistic: Examples, How and When to Use the Test

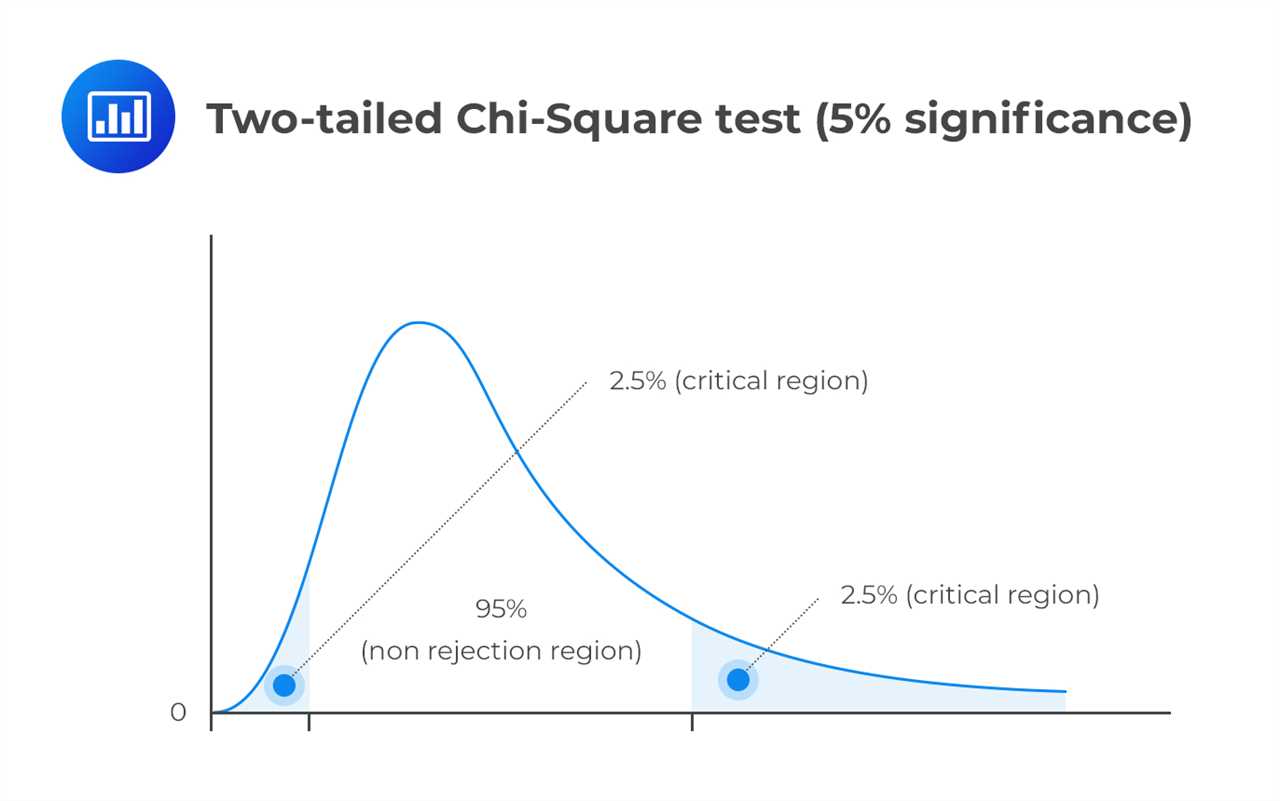
What is Chi-Square Statistic? The Chi-Square Statistic is a statistical test that is used to determine if there is a significant association between two categorical variables. It is often used to analyze data that is in the form of frequencies or counts, such as survey responses or the number of …

Anomaly Definition and Types in Economics and Finance

Anomaly Definition and Types in Economics and Finance In the field of economics and finance, anomalies refer to deviations from the expected or normal behavior of economic and financial variables. These anomalies can occur in various forms and have significant implications for decision-making processes. Furthermore, there are behavioral anomalies, which …