Technical Indicator: Definition, Analyst Uses, Types and Examples

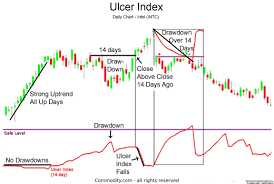
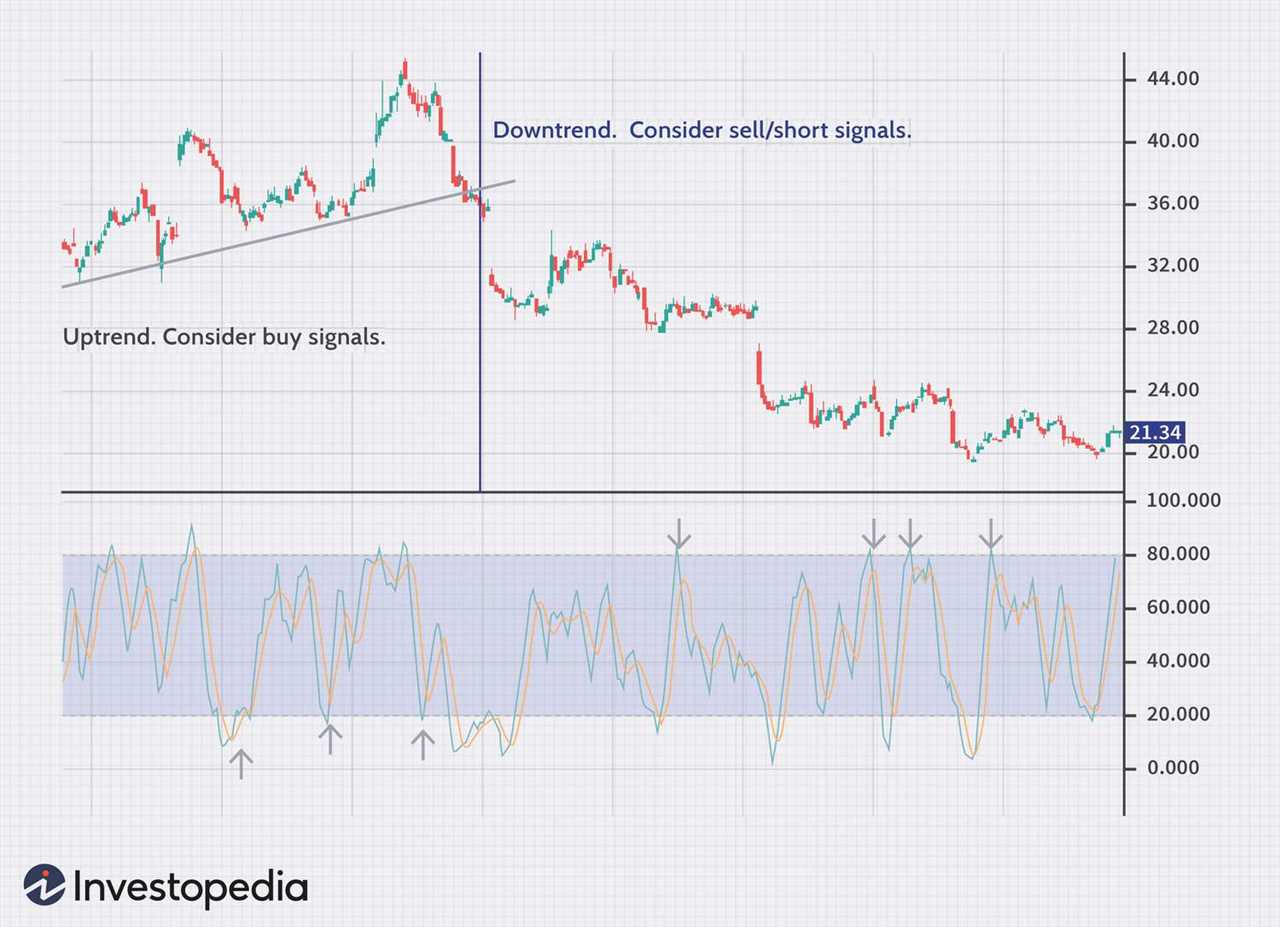
Technical Indicator: Definition A technical indicator is a mathematical calculation that is applied to a financial instrument’s price and/or volume to help identify potential trading opportunities. It is used by technical analysts to analyze historical price and volume data and make predictions about future price movements. Technical indicators are based …

Relative Strength Definition in Investing and Stock Analysis

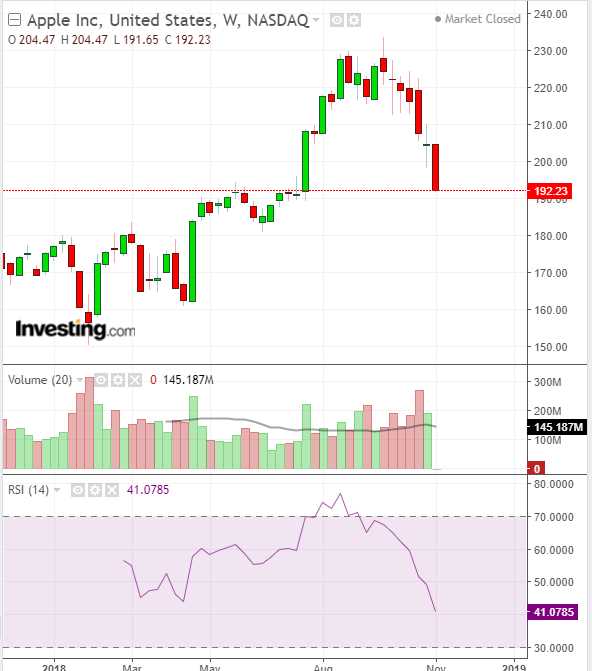
What is Relative Strength? Relative strength is a concept used in investing and stock analysis to compare the performance of a particular stock or investment to a benchmark or index. It provides investors with a way to assess the relative performance of a stock in relation to the overall market …

Line Graph: Definition Types Parts Uses and Examples

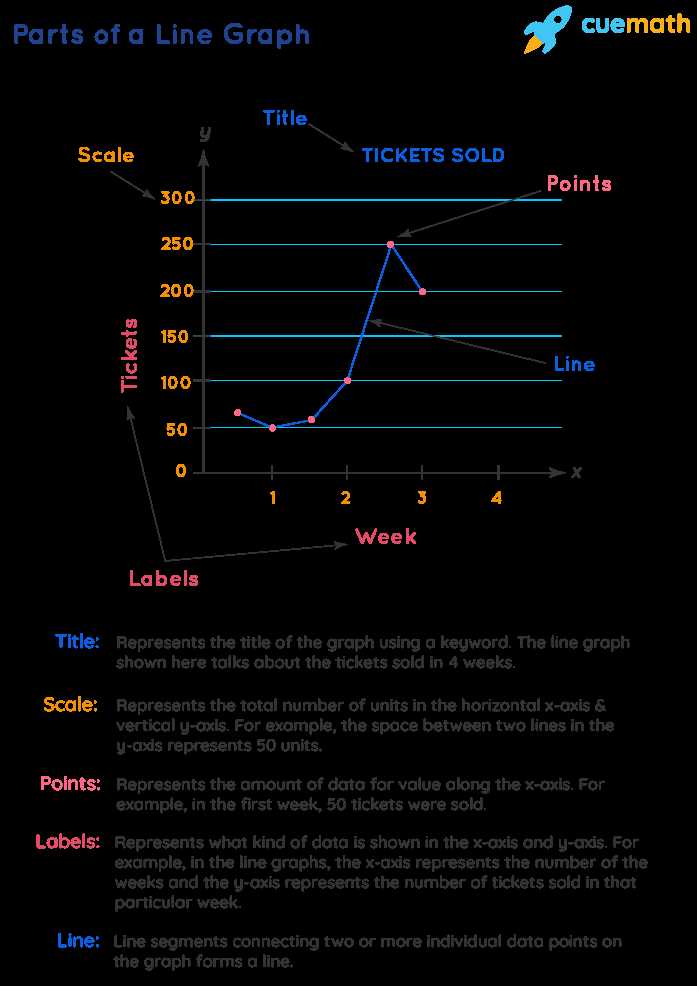
Line Graph: Definition, Types, Parts, Uses, and Examples A line graph is a type of chart used to represent data over time. It consists of a series of data points connected by straight lines, which allows for the visualization of trends and patterns. Line graphs are commonly used in various …