The Least Squares Criterion And Its Functionality

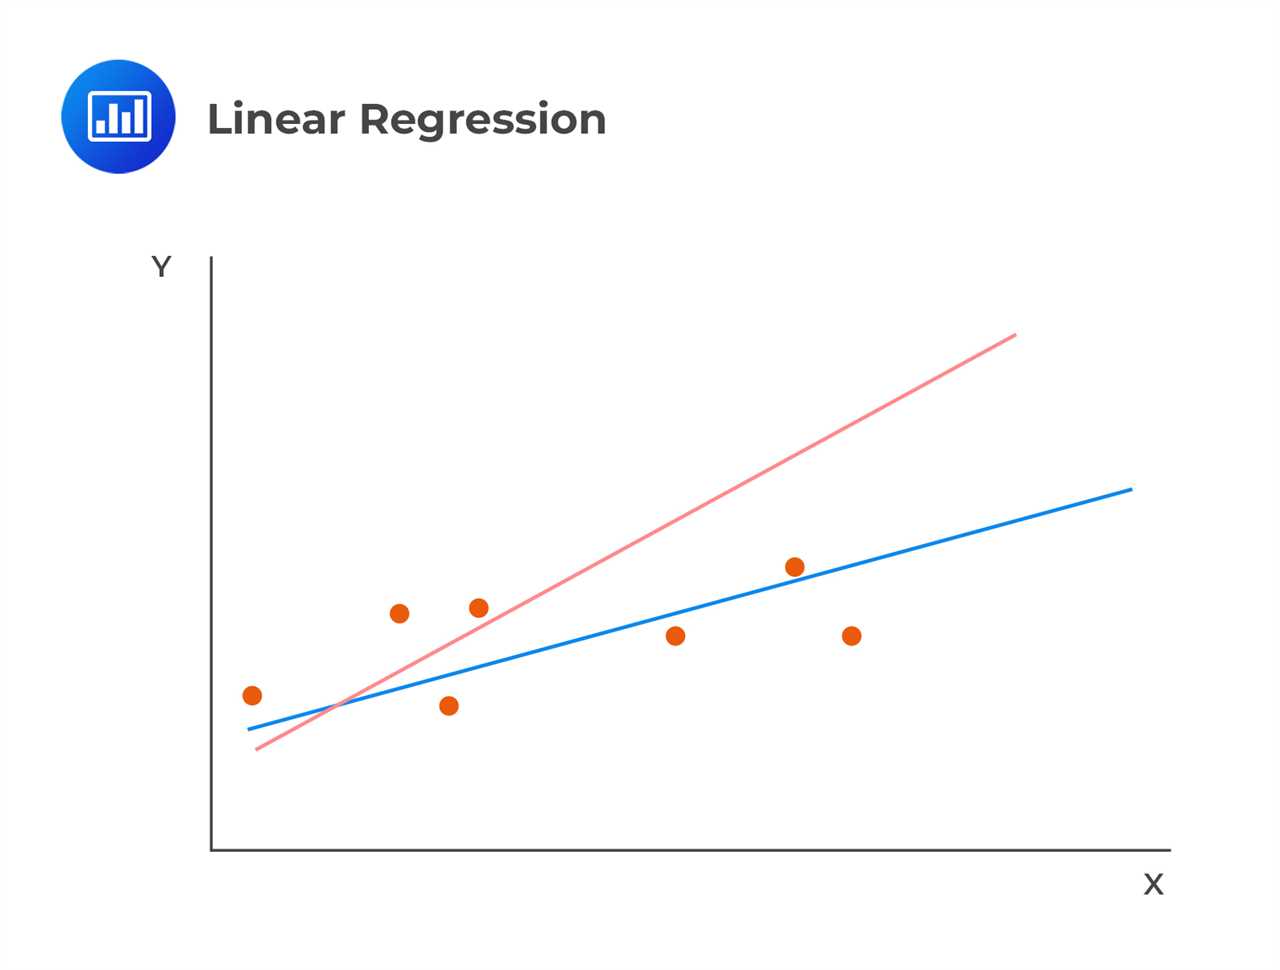
What is the Least Squares Criterion? The Least Squares Criterion is a mathematical method used in financial analysis to find the best-fitting line or curve that minimizes the sum of the squared differences between the observed and predicted values. It is commonly used in regression analysis, where the goal is …

Understanding the GARCH Process and Its Applications

What is the GARCH Process? The GARCH (Generalized Autoregressive Conditional Heteroskedasticity) process is a statistical model used in financial analysis to capture the volatility clustering and time-varying nature of financial returns. It is a popular tool for modeling and forecasting volatility in financial markets. The GARCH process is an extension …

The Co-Efficient Of Variation And Its Practical Applications

What is the Co-efficient of Variation? The co-efficient of variation (CV) is a statistical measure that is used to assess the relative variability of a dataset. It is a standardized measure that allows for the comparison of variability between different datasets, regardless of their units of measurement. The CV is …

Understanding Systematic Sampling and Its Application in Research

What is Systematic Sampling? Systematic sampling is a method used in research to select a sample from a larger population. It involves selecting every nth element from the population, where n is a predetermined interval. This sampling technique is widely used in various fields, including market research, social sciences, and …

Subjective Probability And Its Practical Applications

What is Subjective Probability? Subjective probability refers to the personal beliefs or judgments of an individual regarding the likelihood of an event occurring. Unlike objective probability, which is based on historical data and mathematical calculations, subjective probability is based on an individual’s perception, intuition, and personal experiences. Subjective probability is …

Stratified Random Sampling: Examples And Benefits

What is Stratified Random Sampling? Stratified random sampling is a sampling technique used in statistics to ensure that a representative sample is obtained from a population. It involves dividing the population into distinct subgroups, or strata, based on certain characteristics or variables. These strata are then randomly sampled in proportion …

Understanding Residual Value: Calculation and Examples

What is Residual Value? Residual value is an important concept in financial analysis as it helps determine the overall value and profitability of an investment. It is particularly relevant for assets that have a significant resale value, such as vehicles, machinery, and real estate. Factors Affecting Residual Value Several factors …

Understanding PEST Analysis: Applications and Benefits in Business

PEST Analysis in Business Strategy PEST analysis is a valuable tool for businesses to understand the external factors that can impact their operations and decision-making processes. By analyzing the political, economic, social, and technological factors that affect a business, organizations can develop effective strategies to navigate the ever-changing business landscape. …

Percentage Changes And How To Calculate Them

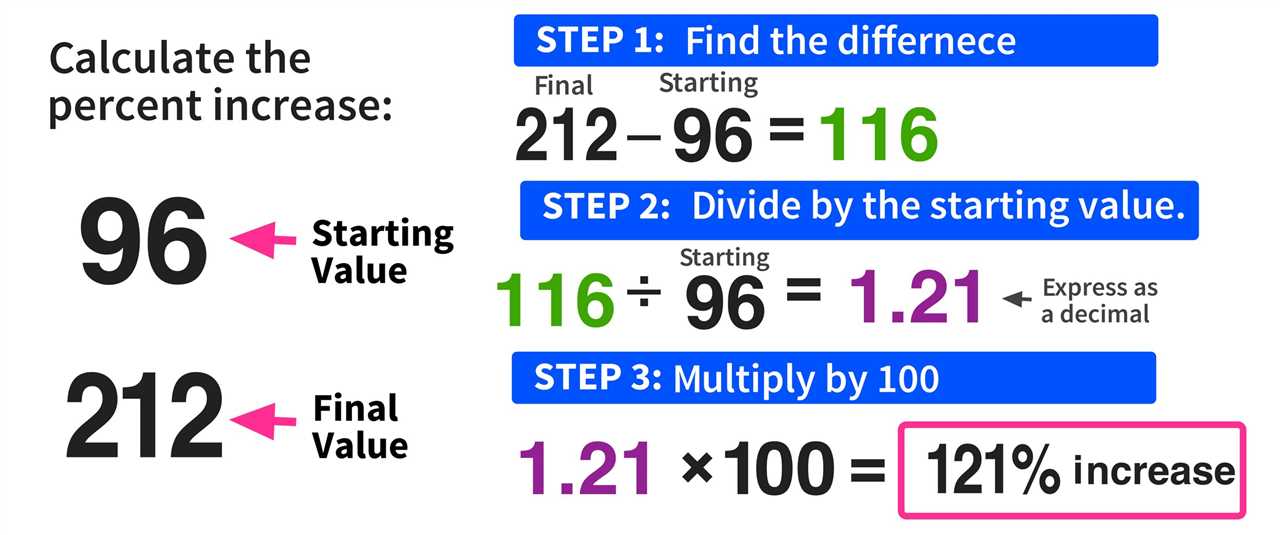
What are Percentage Changes? Percentage changes are a way to express the difference between two values as a percentage of the original value. They are commonly used in financial analysis to measure the growth or decline of various financial indicators such as stock prices, revenue, or profit. Percentage changes provide …

Owner Earnings Run Rate: Benefits, Calculation, And Limitations

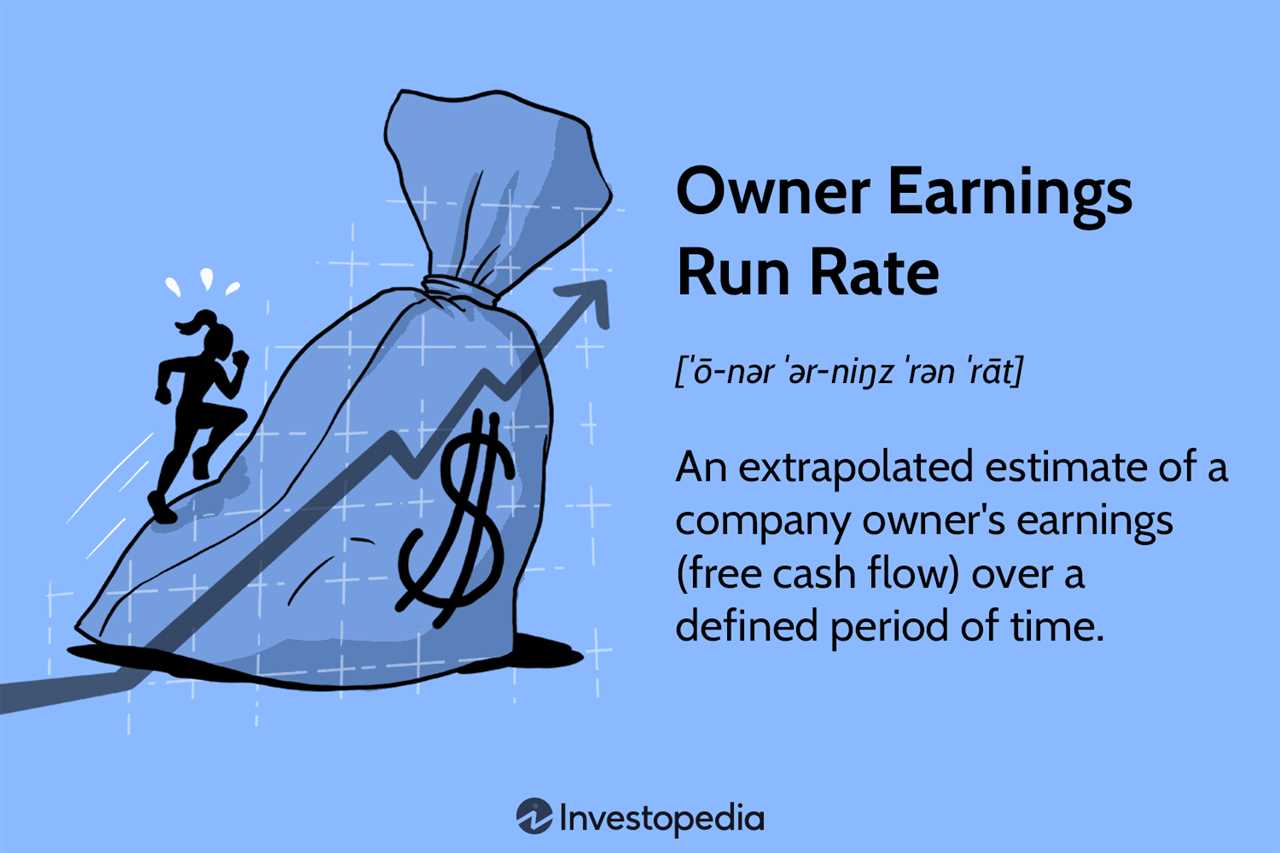
Financial Analysis Catname In financial analysis, the term “catname” refers to a category or classification of financial data. It is used to group similar types of financial information together for analysis and comparison. By categorizing financial data into catnames, analysts can gain insights into various aspects of a company’s financial …

Overfitting: How To Prevent It

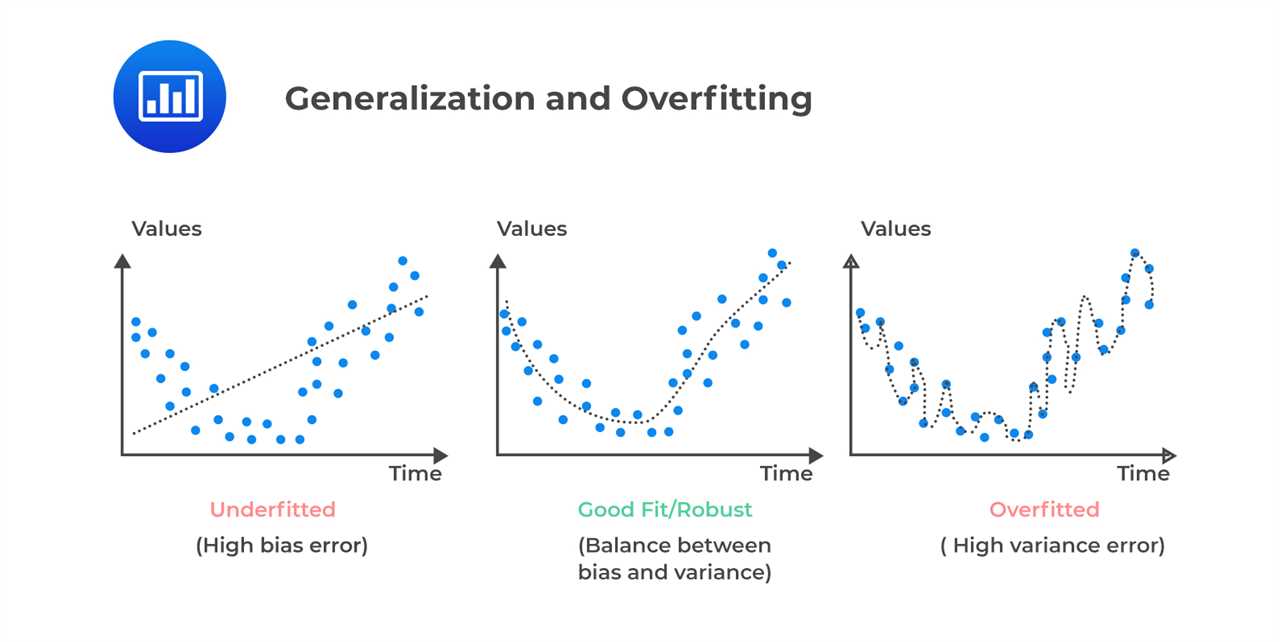
What is Overfitting in Financial Analysis? In financial analysis, overfitting refers to the phenomenon when a model or algorithm is too closely fitted to a particular dataset, resulting in poor performance when applied to new data. It occurs when the model captures noise or random fluctuations in the data instead …

Organic Growth And Its Importance For Investors

What is Organic Growth? Organic growth refers to the increase in a company’s revenue and profitability that is achieved through internal means, rather than through mergers, acquisitions, or other external factors. It is the result of a company’s ability to expand its operations, increase sales, and generate higher profits from …

Non-Sampling Error And Its Impact On Data Analysis

Definition and Types of Non-Sampling Error Non-sampling error refers to errors that occur during data collection, processing, and analysis, which are not related to the sampling process itself. These errors can occur due to various reasons and can have a significant impact on the accuracy and reliability of the data …

Understanding Mean-Variance Analysis: A Guide to Portfolio Optimization

A Guide to Portfolio Optimization Portfolio optimization is a crucial aspect of financial analysis, aimed at maximizing returns while minimizing risks. By diversifying investments across different assets, investors can reduce the impact of individual asset performance on their overall portfolio. Mean-variance analysis is a widely used technique for portfolio optimization. …

Market Value Added (MVA): Advantages And How To Calculate

What is Market Value Added? Market Value Added (MVA) is a financial metric that measures the value a company has created for its shareholders over a specific period of time. It is calculated by subtracting the total invested capital from the market value of the company. MVA is a measure …

Understanding Marginal Benefit in Economics and Its Functionality

Definition and Importance of Marginal Benefit In economics, marginal benefit refers to the additional satisfaction or utility that a person derives from consuming one additional unit of a good or service. It is the increase in total benefit that results from consuming an additional unit of a product. Marginal benefit …

Long-Run Average Total Cost: Definition And Example

Definition of Long-Run Average Total Cost The long-run average total cost (LRATC) is a concept in economics that measures the average cost per unit of output in the long run, when all inputs can be varied. It is calculated by dividing the total cost of production by the total quantity …

Liquidity Risk In Banks And Business: Examples And Strategies

Definition and Importance Liquidity risk refers to the potential for a bank or business to be unable to meet its short-term financial obligations. It is a crucial aspect of financial management as it can have severe consequences if not properly managed. Having sufficient liquidity is vital for the smooth operation …

Joint Probability: Definition, Formula, And Example

Definition of Joint Probability Joint probability is a concept in probability theory that measures the likelihood of two or more events occurring simultaneously. It is used to analyze the relationship between multiple variables and understand the probability of their combined outcomes. When dealing with joint probability, we are interested in …

Jensen’S Measure (Alpha) And Its Calculation

Importance of Jensen’s Measure in Financial Analysis By comparing the actual returns of a portfolio or security with the expected returns based on the risk-free rate of return and the systematic risk, Jensen’s Measure helps to assess the value added by active portfolio management. It helps investors to identify whether …

Idle Time And Its Impact On Businesses

The Concept of Idle Time Causes of Idle Time There are various factors that can contribute to idle time in a business. Some common causes include: Machine breakdowns or maintenance: When equipment malfunctions or requires routine maintenance, it can result in downtime and idle time. Waiting for materials or supplies: …

Understanding Gap Analysis: Definition, Process, and Benefits

What is Gap Analysis? Gap analysis is a strategic planning tool that helps organizations identify the difference or “gap” between their current state and their desired future state. It involves comparing the actual performance of an organization or project with its potential or desired performance. By identifying these gaps, organizations …

Excess Returns: Meaning, Risk, And Formulas

What are Excess Returns? Expected returns are calculated based on various factors such as historical performance, market conditions, and risk factors. These factors help investors estimate the average returns that they can expect from a particular investment. Excess returns can be positive or negative. Positive excess returns indicate that the …

Correlation In Finance And How To Calculate It

What is Correlation? Correlation is a statistical measure that quantifies the relationship between two variables. It indicates how closely the variables move together and whether they have a positive or negative relationship. In finance, correlation is used to understand the degree to which the prices or returns of different assets …

Capital Market Line And How To Calculate It

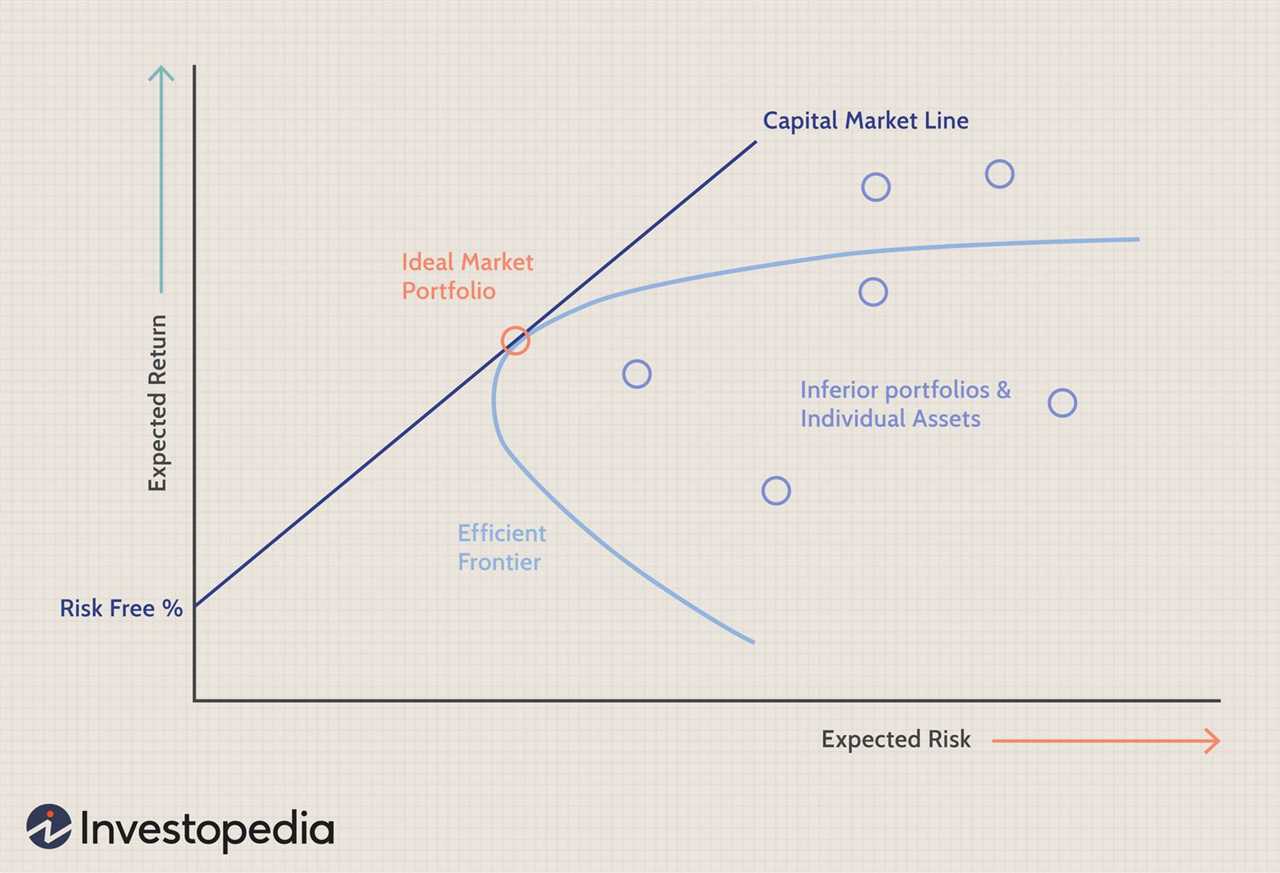
What is Capital Market Line? The Capital Market Line (CML) is a graphical representation of the risk-return tradeoff for a portfolio of risky assets. It shows the relationship between the expected return and the standard deviation of a portfolio. The CML is derived from the efficient frontier, which represents the …