
What is Breakout?
Breakout is a term used in technical analysis to describe a situation where the price of a security breaks through a significant level of support or resistance. It signifies a shift in market sentiment and often leads to a significant price movement in the direction of the breakout.
Definition
In technical analysis, a breakout occurs when the price of a security surpasses a key level of support or resistance. Support is a price level at which buying pressure is expected to outweigh selling pressure, causing the price to bounce back up. Resistance, on the other hand, is a price level at which selling pressure is expected to outweigh buying pressure, causing the price to reverse and move downwards.
When the price breaks through a level of support or resistance, it indicates that the balance between buyers and sellers has shifted, and a new trend may be emerging. Breakouts can occur in any direction, either to the upside or the downside, depending on the prevailing market conditions.
Meaning
Breakouts can also be used to confirm the validity of technical patterns, such as triangles, rectangles, or head and shoulders formations. When the price breaks out of these patterns, it adds credibility to the pattern and increases the likelihood of a successful trade.
Example
Let’s say a stock has been trading in a range between $50 and $60 for several months. Traders are closely watching this range for a breakout. If the price suddenly surges above $60 and continues to rise, it would be considered a breakout to the upside. This breakout could indicate a bullish trend and attract more buyers into the market.
On the other hand, if the price drops below $50 and continues to decline, it would be considered a breakout to the downside. This breakout could indicate a bearish trend and prompt more sellers to enter the market.
| Key Points: |
|---|
| – Breakout occurs when the price surpasses a significant level of support or resistance. |
| – It signifies a shift in market sentiment and often leads to a significant price movement. |
| – Breakouts can be used to enter or exit positions and confirm the validity of technical patterns. |
Breakout is a term commonly used in technical analysis to describe a significant price movement that breaks through a predefined level of support or resistance. It refers to a situation where the price of a security moves beyond a certain range, indicating a potential change in the trend or a continuation of the current trend with increased momentum.
Definition of Breakout
A breakout occurs when the price of a security moves above a resistance level or below a support level, with significant volume and momentum. It signifies a shift in market sentiment and often leads to a sharp price movement in the direction of the breakout.
Meaning of Breakout
For example, if a stock has been trading within a range of $50 to $60 for an extended period and suddenly breaks above $60 with increased volume, it suggests that buyers have gained control, and the stock may continue to rise. Conversely, if the stock breaks below $50 with high volume, it indicates that sellers have taken control, and the stock may decline further.
Example of Breakout
Let’s consider the example of a breakout in a stock chart. Suppose a stock has been trading within a range of $100 to $120 for several weeks. Traders and investors closely monitor this range, waiting for a breakout to occur.
One day, the stock breaks above the $120 resistance level with a surge in volume. This breakout signals a potential upward trend reversal or continuation, as it suggests that buyers are entering the market with increased enthusiasm.
Traders who identify this breakout may choose to enter long positions, anticipating further price appreciation. They may set stop-loss orders below the breakout level to limit potential losses if the breakout fails.
Breakout in Technical Analysis
Breakouts occur when the price of a security breaks above a resistance level or below a support level. Resistance is a price level at which selling pressure is expected to be strong, causing the price to reverse or stall. Support, on the other hand, is a price level at which buying pressure is expected to be strong, preventing the price from falling further.
When a breakout occurs, it signifies that the prevailing buying or selling pressure has become strong enough to overcome the opposing pressure, leading to a significant price movement in the breakout direction. This can result in a rapid increase or decrease in the price of the security.
Identifying Breakout Patterns
Traders use various technical indicators and chart patterns to identify potential breakouts. Some common breakout patterns include:
- Triangle Breakout: This pattern forms when the price consolidates within a triangle-shaped pattern, eventually breaking out in either an upward or downward direction.
- Head and Shoulders Breakout: This pattern consists of a peak (head) with two smaller peaks (shoulders) on either side. A breakout occurs when the price breaks below the neckline, indicating a potential reversal.
- Double Top/Bottom Breakout: This pattern occurs when the price reaches a resistance level twice (double top) or a support level twice (double bottom) before breaking out in the opposite direction.
Breakout Strategies
Traders often develop breakout strategies to capitalize on potential price movements following a breakout. Some popular breakout strategies include:
- Breakout Trading: Traders enter a position when the price breaks above a resistance level or below a support level, expecting the price to continue in the breakout direction.
- Retest and Continuation: Traders wait for a breakout to occur, then wait for a retest of the breakout level before entering a position. This strategy aims to confirm the validity of the breakout.
- False Breakout Trading: Traders take advantage of false breakouts, where the price briefly breaks above a resistance level or below a support level but quickly reverses. They enter a position in the opposite direction, expecting the price to reverse again.
It is important for traders to carefully analyze the market conditions and use appropriate risk management techniques when trading breakouts, as false breakouts and whipsaws can occur.
Exploring the Basics of Breakout Patterns and Strategies
Types of Breakout Patterns
There are several common breakout patterns that traders look for:
- Continuation Breakout: This pattern occurs when the price breaks out of a consolidation phase and continues in the direction of the previous trend. Traders often see this as a confirmation of the existing trend.
- Reversal Breakout: In contrast to the continuation breakout, a reversal breakout happens when the price breaks out of a consolidation phase and reverses its previous trend. This can signal a potential trend reversal.
- Range Breakout: A range breakout occurs when the price breaks out of a well-defined trading range. This can indicate the start of a new trend or increased volatility.
- Triangle Breakout: Triangle patterns are formed when the price consolidates between two converging trendlines. A breakout from the triangle can signal a significant move in either direction.
Strategies for Trading Breakouts
Traders employ various strategies to take advantage of breakout patterns:
- Breakout Trading: This strategy involves entering a trade when the price breaks out of a key level of support or resistance. Traders often use technical indicators or chart patterns to confirm the breakout.
- Pullback Trading: After a breakout, the price may experience a temporary pullback before resuming its trend. Traders who employ this strategy look for opportunities to enter the market during the pullback.
- False Breakout Trading: False breakouts occur when the price briefly breaks out of a level but quickly reverses. Traders who use this strategy aim to profit from these false moves by entering trades in the opposite direction.
Breakout Examples
Breakouts are a common occurrence in technical analysis and can provide valuable trading opportunities. Here are some examples of breakout patterns and strategies:
1. Resistance Breakout
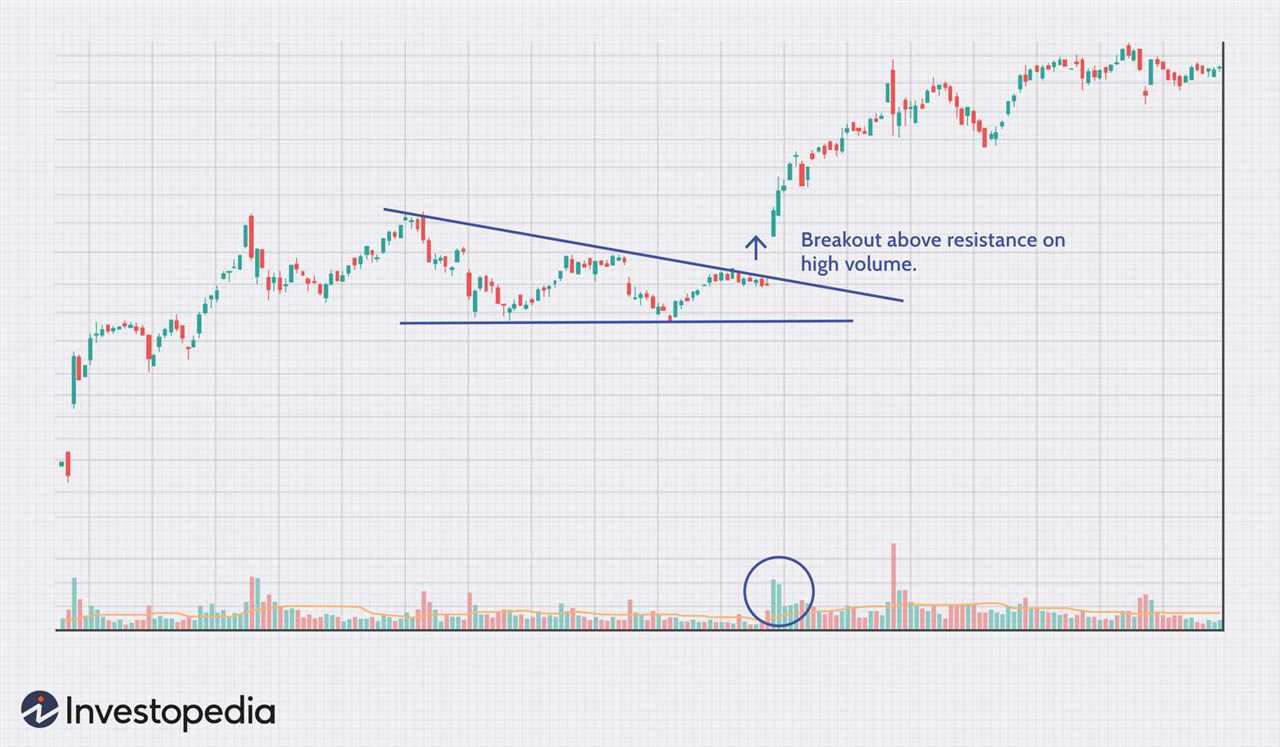
A resistance breakout occurs when the price of an asset breaks above a significant level of resistance. This indicates that buying pressure has overcome selling pressure and suggests that the price may continue to rise. Traders often look for confirmation of the breakout through increased volume or a retest of the breakout level.
2. Support Breakout
A support breakout occurs when the price of an asset breaks below a significant level of support. This indicates that selling pressure has overcome buying pressure and suggests that the price may continue to decline. Traders often look for confirmation of the breakout through increased volume or a retest of the breakout level.
3. Trendline Breakout
A trendline breakout occurs when the price of an asset breaks above or below a trendline that has been drawn to connect the highs or lows of price movements. This breakout suggests a potential change in the trend and can be used to identify buying or selling opportunities.
4. Chart Pattern Breakout
Chart patterns, such as triangles, rectangles, and head and shoulders, can also experience breakouts. These patterns form as a result of price consolidation and indicate a potential continuation or reversal of the current trend. Traders look for breakouts of these patterns to enter trades with defined risk and reward levels.
5. Volatility Breakout
A volatility breakout occurs when the price of an asset breaks out of a period of low volatility and experiences a significant price movement. This breakout can be identified by an increase in trading range or a sudden surge in volume. Traders often use volatility breakouts to capture large price moves.
When trading breakouts, it is important to consider risk management techniques, such as setting stop-loss orders and taking profits at predetermined levels. Additionally, traders should always be aware of false breakouts, where the price briefly breaks out but quickly reverses back within the previous range.

Emily Bibb simplifies finance through bestselling books and articles, bridging complex concepts for everyday understanding. Engaging audiences via social media, she shares insights for financial success. Active in seminars and philanthropy, Bibb aims to create a more financially informed society, driven by her passion for empowering others.