What are Comps?

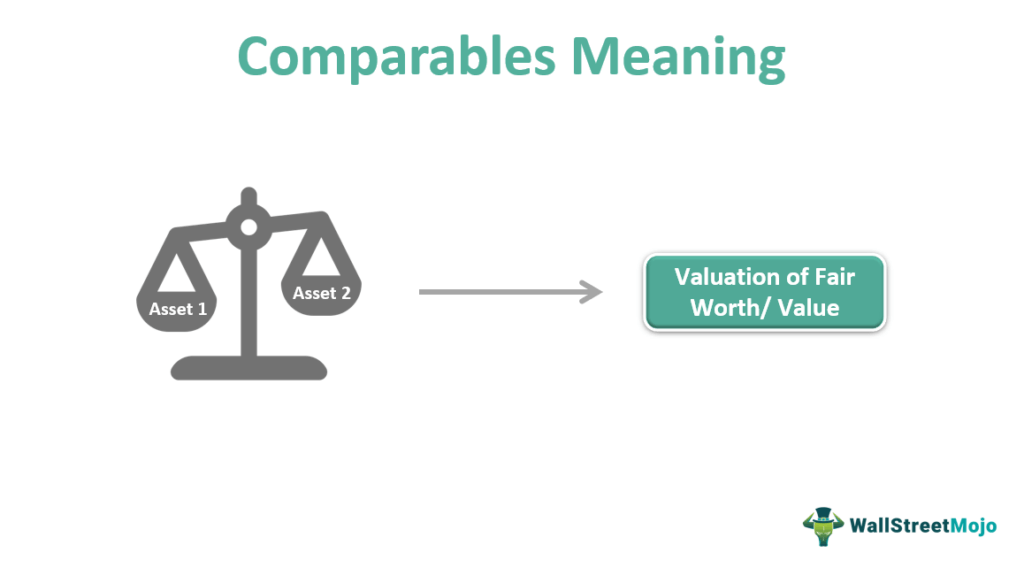
Comps, short for comparables, are a key component of financial analysis. They refer to a group of similar companies that are used to compare and evaluate the performance, valuation, and financial health of a target company.
Comps analysis involves selecting a group of companies that are similar to the target company in terms of industry, size, growth prospects, and other relevant factors. These companies serve as benchmarks against which the target company’s performance is measured.
Comps analysis is commonly used in various financial analysis techniques, such as valuation, benchmarking, and investment research. It provides valuable insights into the relative position of the target company within its industry and helps investors and analysts make informed decisions.
The importance of comps analysis lies in its ability to provide a comparative framework for evaluating a company’s financial performance. By comparing key financial metrics, such as revenue, profitability, and growth rates, with those of its peers, analysts can identify strengths, weaknesses, and areas for improvement.
The methodology for comps analysis typically involves gathering and analyzing financial data of the target company and its comparable peers. This data may include financial statements, industry reports, market data, and other relevant sources. The analysis can be performed using various quantitative and qualitative techniques, such as ratio analysis, trend analysis, and peer group comparisons.
To illustrate the concept of comps analysis, let’s consider an example. Suppose we want to evaluate the financial health of Company XYZ, a technology company. We would select a group of similar technology companies, such as Company ABC, Company DEF, and Company GHI, as comps. We would then compare various financial metrics, such as revenue growth, profit margins, and return on investment, to assess Company XYZ’s performance relative to its peers.
Definition and Explanation
Comps, short for comparables, are a key component of financial analysis. They refer to a group of similar companies that are used as a benchmark to evaluate the performance and valuation of a target company. By comparing the financial metrics and ratios of the target company with those of its comps, analysts can gain insights into its relative strength, weaknesses, and market position.
The selection of comps is crucial and should be based on factors such as industry, size, geography, and business model. Ideally, the comps should be companies that operate in the same industry and face similar market conditions. This ensures a meaningful comparison and allows for a more accurate assessment of the target company’s performance.
Comps analysis involves gathering and analyzing financial data such as revenue, profitability, growth rates, and valuation multiples of both the target company and its comps. This information is then used to calculate various financial ratios and metrics, such as price-to-earnings ratio, return on equity, and market capitalization. These ratios provide a quantitative basis for comparing the target company’s performance with that of its comps.
The importance of comps analysis lies in its ability to provide valuable insights into a company’s competitive position and potential for growth. By comparing a company’s financial performance with that of its comps, analysts can identify areas of strength and weakness, assess its relative valuation, and make informed investment decisions.
The methodology for comps analysis involves several steps. First, a list of potential comps is compiled based on industry and other relevant criteria. Then, financial data for both the target company and its comps is gathered from various sources, such as financial statements and industry reports. Next, the data is analyzed and compared using various financial ratios and metrics. Finally, the findings are interpreted and used to draw conclusions about the target company’s performance and valuation.
Overall, comps analysis is a valuable tool in financial analysis that allows for a comprehensive evaluation of a company’s performance and valuation. By comparing a company’s financial metrics with those of its comps, analysts can gain insights into its competitive position, identify areas for improvement, and make informed investment decisions.
Comps Analysis
Comps analysis, short for comparable company analysis, is a valuation method used in financial analysis to determine the value of a company by comparing it to similar companies in the same industry. This analysis helps investors and analysts understand the relative value of a company and make informed investment decisions.
During a comps analysis, several key financial metrics are compared between the target company and its peers. These metrics may include revenue, earnings, profit margins, return on equity, and other relevant financial ratios. By comparing these metrics, analysts can assess how the target company performs compared to its competitors.
Importance of Comps Analysis

Comps analysis is important because it provides a benchmark for evaluating a company’s performance and valuation. By comparing a company to its peers, investors can gain insights into its competitive position, growth potential, and financial health. This analysis also helps in identifying any disparities or anomalies in a company’s financial performance.
Additionally, comps analysis is useful for determining a company’s valuation. By comparing a company’s financial metrics to those of similar companies that are publicly traded, analysts can estimate its intrinsic value and assess whether it is overvalued or undervalued in the market.
Methodology of Comps Analysis
The methodology of comps analysis involves several steps:
- Identifying comparable companies: Analysts select a group of companies that are similar to the target company in terms of industry, size, and business model.
- Gathering financial data: Financial data, such as revenue, earnings, and other relevant metrics, are collected for both the target company and its comparable companies.
- Normalizing financial data: To ensure comparability, the financial data is adjusted for any differences in accounting methods or reporting standards.
- Calculating financial ratios: Key financial ratios, such as price-to-earnings ratio, price-to-sales ratio, and return on equity, are calculated for the target company and its comparable companies.
- Comparing financial ratios: The financial ratios of the target company are compared to those of its comparable companies to assess its relative performance and valuation.
It is important to note that comps analysis should not be the sole basis for making investment decisions. Other factors, such as industry trends, market conditions, and qualitative factors, should also be taken into consideration.
Overall, comps analysis provides valuable insights into a company’s performance, valuation, and competitive position. By comparing a company to its peers, investors and analysts can make more informed investment decisions and better understand the financial health of the company.
Importance and Methodology
The importance of comps analysis lies in its ability to provide a benchmark for evaluating a company’s financial health, growth prospects, and market value. By comparing a company’s financial ratios, such as price-to-earnings (P/E) ratio, price-to-sales (P/S) ratio, and return on equity (ROE), to those of its peers, investors can gain insights into its relative strengths and weaknesses.
Comps analysis also helps in identifying potential investment opportunities and risks. If a company’s valuation metrics are significantly higher or lower than its peers, it may indicate overvaluation or undervaluation. This information can guide investors in making informed decisions about buying or selling stocks.
The methodology of comps analysis involves several steps. Firstly, a peer group of comparable companies is selected based on factors such as industry, size, and business model. These companies should have similar operations and financial characteristics to the target company.
Once the peer group is established, financial data of the target company and its peers are collected and analyzed. This includes revenue, earnings, cash flow, and balance sheet information. Key financial ratios are calculated and compared to determine the relative performance and valuation of the target company.
It is important to note that comps analysis has its limitations. The selection of comparable companies may be subjective, and differences in accounting practices or business models can distort the results. Therefore, it is crucial to exercise caution and consider other factors when interpreting the findings of comps analysis.
| Steps in Comps Analysis | Description |
|---|---|
| 1. Select Peer Group | Select comparable companies based on industry, size, and business model. |
| 2. Collect Financial Data | Gather financial information of the target company and its peers. |
| 3. Calculate Financial Ratios | Calculate key financial ratios such as P/E ratio, P/S ratio, and ROE. |
| 4. Compare Ratios | Compare the ratios of the target company to those of its peers. |
| 5. Interpret Results | Interpret the findings and consider other factors for a comprehensive analysis. |
Example of Comps Analysis
Let’s consider an example to understand how comps analysis works in practice. Imagine we want to analyze the financial performance of two companies in the technology industry: Company A and Company B.
Step 1: Select Comparable Companies

Step 2: Gather Financial Data
Step 3: Calculate Financial Ratios
Once we have the financial data, we can calculate various financial ratios to compare the performance of the companies. Some commonly used ratios in comps analysis include the price-to-earnings ratio (P/E ratio), price-to-sales ratio (P/S ratio), and return on equity (ROE).
Step 4: Compare and Interpret the Results
After calculating the financial ratios, we can compare the results of the companies and interpret their performance. For example, if Company A has a higher P/E ratio compared to Company C, it may indicate that investors have higher expectations for the future earnings growth of Company A.
Similarly, if Company B has a lower P/S ratio compared to Company D, it may suggest that Company B is undervalued in the market relative to its sales revenue.%

Emily Bibb simplifies finance through bestselling books and articles, bridging complex concepts for everyday understanding. Engaging audiences via social media, she shares insights for financial success. Active in seminars and philanthropy, Bibb aims to create a more financially informed society, driven by her passion for empowering others.
