
Average Selling Price Calculation and Examples
In order to understand the concept of average selling price (ASP), it is important to first define what it means. ASP is the average price at which a product or service is sold over a specific period of time. It is a key metric used in business and financial analysis to evaluate the performance of a company or industry.
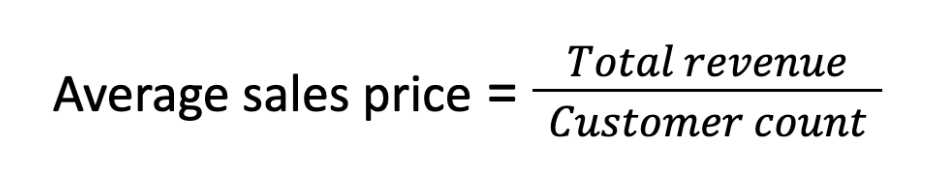
Calculation of Average Selling Price
The calculation of ASP is relatively simple. It involves dividing the total revenue generated from sales by the total number of units sold. The formula for calculating ASP is as follows:
ASP = Total Revenue / Total Units Sold
For example, let’s consider a company that generated a total revenue of $100,000 from selling 1,000 units of a product. The ASP for this company would be:
ASP = $100,000 / 1,000 = $100
This means that, on average, each unit of the product was sold for $100.
Importance of Average Selling Price
The average selling price is an important metric for several reasons. Firstly, it provides insight into the pricing strategy of a company. A higher ASP may indicate that the company is able to command premium prices for its products, while a lower ASP may suggest a more competitive pricing strategy.
Examples of Average Selling Price
Let’s consider a few examples to further illustrate the concept of ASP:
| Company | Total Revenue | Total Units Sold | ASP |
|---|---|---|---|
| Company A | $500,000 | 5,000 | $100 |
| Company B | $1,000,000 | 10,000 | $100 |
| Company C | $750,000 | 7,500 | $100 |
In the above examples, all three companies have an ASP of $100, indicating that they are selling their products at the same average price. However, it is important to note that the total revenue and total units sold vary for each company, highlighting the differences in their sales performance.
Fundamental Analysis
One of the key components of fundamental analysis is the calculation of the average selling price (ASP) of a company’s products or services. The ASP is an important metric that helps investors understand the pricing dynamics of a company and its ability to generate profits.
To calculate the ASP, you need to divide the total revenue generated from product sales by the total number of units sold. This will give you the average price at which the company is selling its products.
Let’s take an example to understand this better. Suppose Company XYZ generated a total revenue of $1,000,000 from the sale of 10,000 units of its product. To calculate the ASP, you would divide $1,000,000 by 10,000, which gives you an ASP of $100.
The ASP can provide valuable insights into a company’s pricing strategy and its ability to maintain profitability. A higher ASP may indicate that the company is able to command premium prices for its products, which could be a positive sign for investors. On the other hand, a lower ASP may indicate intense competition or pricing pressure, which could negatively impact the company’s profitability.
Fundamental Analysis
Importance of Fundamental Analysis
Fundamental analysis is important because it helps investors understand the true value of a stock and make informed investment decisions. By analyzing the fundamental factors that drive a company’s performance, investors can identify stocks that are undervalued or overvalued in the market. This analysis provides a solid foundation for long-term investment strategies and helps investors avoid making impulsive decisions based on short-term market fluctuations.
Key Components of Fundamental Analysis
There are several key components of fundamental analysis that investors should consider:
- Financial Statements: Analyzing a company’s financial statements, including the income statement, balance sheet, and cash flow statement, provides insights into its financial health, profitability, and cash flow generation.
- Management Evaluation: Evaluating the quality and competence of a company’s management team is crucial as it plays a significant role in the company’s success.
- Economic Factors: Considering macroeconomic factors such as interest rates, inflation, and GDP growth can help investors gauge the overall economic environment and its impact on the company’s performance.
- Competitive Analysis: Analyzing the company’s competitors and their market share can provide insights into the company’s competitive advantage and market positioning.
Using Fundamental Analysis in Stock Valuation

Fundamental analysis is used to determine the intrinsic value of a stock, which is then compared to its market price to identify potential investment opportunities. There are various valuation methods used in fundamental analysis, including:
- Discounted Cash Flow (DCF) Analysis: This method estimates the present value of a company’s future cash flows, taking into account the time value of money.
- Price-to-Earnings (P/E) Ratio: This ratio compares a company’s stock price to its earnings per share, providing insights into its relative valuation.
- Price-to-Sales (P/S) Ratio: This ratio compares a company’s stock price to its revenue per share, indicating its valuation relative to its sales.
- Book Value: This method compares a company’s assets to its liabilities to determine its net worth.
Conclusion
Fundamental analysis is a critical tool for investors to assess the value of a stock and make informed investment decisions. By analyzing various financial and non-financial factors, investors can identify stocks that are undervalued or overvalued, providing opportunities for long-term growth and profitability. It is important for investors to conduct thorough fundamental analysis before making investment decisions to mitigate risks and maximize returns.

Emily Bibb simplifies finance through bestselling books and articles, bridging complex concepts for everyday understanding. Engaging audiences via social media, she shares insights for financial success. Active in seminars and philanthropy, Bibb aims to create a more financially informed society, driven by her passion for empowering others.