
Russell 2000 Index: Definition and Key Metrics
The Russell 2000 Index is a stock market index that measures the performance of approximately 2,000 small-cap companies in the United States. It is widely regarded as a benchmark for small-cap stocks and is often used by investors and financial professionals to gauge the overall health of the small-cap segment of the market.
Definition
The Russell 2000 Index is maintained by the FTSE Russell, a subsidiary of the London Stock Exchange Group. It is composed of the smallest 2,000 stocks in the Russell 3000 Index, which includes the 3,000 largest publicly traded companies in the US. The index is market-capitalization weighted, meaning that the companies with higher market values have a greater impact on the index’s performance.
Key Metrics
There are several key metrics that are used to evaluate the performance of the Russell 2000 Index:
- Market Capitalization: The total market value of all the companies in the index.
- Price-to-Earnings Ratio (P/E ratio): The ratio of a company’s stock price to its earnings per share. It is used to assess the valuation of a company’s stock.
- Dividend Yield: The annual dividend payment of a company divided by its stock price. It is used to measure the income generated by a stock investment.
- Volatility: The degree of variation in the price of the index. Higher volatility indicates greater price fluctuations.
These metrics provide valuable insights into the performance and characteristics of the small-cap companies represented in the Russell 2000 Index.
Investors and financial professionals use the Russell 2000 Index as a benchmark to compare the performance of their small-cap investments. It allows them to assess whether their investments are outperforming or underperforming the broader small-cap market.
Furthermore, the index is often used as a barometer for the overall health of the US economy. Since small-cap companies are considered to be more sensitive to changes in the domestic economy, the performance of the Russell 2000 Index can provide valuable information about the state of the US markets.
What is the Russell 2000 Index?
The Russell 2000 Index is a stock market index that measures the performance of approximately 2,000 small-cap companies in the United States. It is widely recognized as a benchmark for small-cap stocks and is often used by investors and fund managers to track the performance of small-cap stocks.
Definition and Key Metrics
The Russell 2000 Index is maintained by FTSE Russell, a leading global provider of financial market data and infrastructure. It is a subset of the broader Russell Indexes, which include the Russell 1000 Index (comprising the largest 1,000 companies) and the Russell 3000 Index (comprising the largest 3,000 companies).
The Russell 2000 Index is market capitalization-weighted, meaning that the weight of each company in the index is determined by its market value. The index is reconstituted annually in June, and companies are added or removed based on their market capitalization rankings.
Key Metrics of the Russell 2000 Index
Some key metrics used to evaluate the performance of the Russell 2000 Index include:
| Metric | Description |
|---|---|
| Market Capitalization | The total market value of a company’s outstanding shares. |
| Price-to-Earnings Ratio (P/E Ratio) | A measure of a company’s valuation, calculated by dividing its stock price by its earnings per share. |
| Dividend Yield | The annual dividend payment of a company divided by its stock price. |
| Return on Equity (ROE) | A measure of a company’s profitability, calculated by dividing its net income by its shareholders’ equity. |
These metrics provide insights into the valuation, dividend payout, and profitability of the companies included in the Russell 2000 Index.
Overall, the Russell 2000 Index serves as an important tool for investors and fund managers to assess the performance of small-cap stocks in the United States. It provides a comprehensive view of the small-cap segment of the market and allows for benchmarking and comparison against other indices. Additionally, the index is often used as a basis for the creation of investment products such as exchange-traded funds (ETFs) and mutual funds that track the performance of small-cap stocks.
How is the Russell 2000 Index Calculated?
The Russell 2000 Index is calculated using a market capitalization-weighted methodology. This means that the index is weighted based on the total market value of the companies included in the index. The market capitalization of a company is calculated by multiplying the company’s stock price by the number of shares outstanding.
To calculate the Russell 2000 Index, all eligible companies are ranked by their total market capitalization from largest to smallest. The index includes the 2,000 smallest companies in the Russell 3000 Index, which is a broader index that represents the overall U.S. stock market. The companies that make up the Russell 2000 Index are primarily small-cap stocks.
Once the companies are ranked, the index is constructed by assigning weights to each company based on its market capitalization. The larger the market capitalization of a company, the higher its weight in the index. This means that companies with a higher market value have a greater impact on the performance of the index.
The Russell 2000 Index is reconstituted annually in June, when the companies included in the index are reviewed and updated. This ensures that the index remains representative of the small-cap segment of the U.S. stock market.
Overall, the calculation methodology of the Russell 2000 Index provides investors with a benchmark to track the performance of small-cap stocks in the U.S. market. It allows investors to gain exposure to this segment of the market and evaluate the performance of their investments relative to the index.
Key Metrics of the Russell 2000 Index
The Russell 2000 Index is a widely followed benchmark that measures the performance of small-cap stocks in the United States. It includes 2,000 companies with smaller market capitalizations, which are often seen as more representative of the overall economy than larger companies.
There are several key metrics used to evaluate the performance of the Russell 2000 Index:
1. Market Capitalization:
Market capitalization is a measure of a company’s size and is calculated by multiplying the number of outstanding shares by the current stock price. The Russell 2000 Index includes companies with market capitalizations ranging from approximately $300 million to $2 billion.
2. Price-to-Earnings Ratio (P/E Ratio):
The P/E ratio is a valuation ratio that compares a company’s stock price to its earnings per share. It is used to determine if a stock is overvalued or undervalued. The Russell 2000 Index typically has a higher P/E ratio compared to larger-cap indexes, as smaller companies are often expected to have higher growth potential.
3. Dividend Yield:
Dividend yield is a financial ratio that shows how much a company pays out in dividends relative to its stock price. The Russell 2000 Index generally has a lower dividend yield compared to larger-cap indexes, as smaller companies tend to reinvest their earnings back into the business for growth.
4. Beta:
Beta is a measure of a stock’s volatility in relation to the overall market. A beta of 1 indicates that the stock’s price moves in line with the market, while a beta greater than 1 indicates higher volatility. The Russell 2000 Index typically has a higher beta compared to larger-cap indexes, as smaller companies are generally more sensitive to market fluctuations.
5. Sector Weightings:
The Russell 2000 Index is divided into various sectors, such as technology, healthcare, financials, and consumer discretionary. The sector weightings indicate the proportion of companies from each sector in the index. This allows investors to see which sectors are driving the performance of the index and make informed investment decisions.
These key metrics provide valuable insights into the performance and characteristics of the Russell 2000 Index. Investors can use this information to assess the risk and return potential of small-cap stocks and make informed investment decisions.
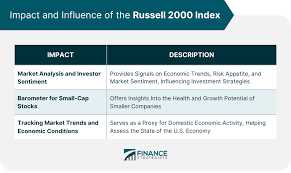
Why is the Russell 2000 Index Important for US Markets?
The Russell 2000 Index is an important benchmark for US markets due to its focus on small-cap stocks. Small-cap stocks are generally considered to be riskier than large-cap stocks, but they also have the potential for higher returns. As such, the performance of the Russell 2000 Index can provide valuable insights into the overall health and direction of the US economy.
One of the key reasons why the Russell 2000 Index is important is that it represents a broad range of industries and sectors. Unlike other indices that may be heavily weighted towards specific sectors, the Russell 2000 Index includes companies from various sectors such as technology, healthcare, finance, and consumer goods. This diversification helps to reduce the impact of any single sector’s performance on the overall index.
Furthermore, the Russell 2000 Index is often used as a benchmark for small-cap mutual funds and exchange-traded funds (ETFs). Many investment managers compare the performance of their small-cap funds to the Russell 2000 Index to assess how well they are performing relative to the broader market. This makes the index an important tool for investors and fund managers to evaluate their investment strategies and make informed decisions.
In addition, the Russell 2000 Index is frequently used by analysts and researchers to study market trends and patterns. By analyzing the performance of small-cap stocks, researchers can gain insights into the overall sentiment and risk appetite of investors. This information can be useful for predicting market movements and identifying potential investment opportunities.
Overall, the Russell 2000 Index plays a crucial role in the US markets by providing a comprehensive view of the performance of small-cap stocks. Its broad representation of industries, use as a benchmark for funds, and value as a research tool make it an important indicator for investors, fund managers, and analysts alike.

Emily Bibb simplifies finance through bestselling books and articles, bridging complex concepts for everyday understanding. Engaging audiences via social media, she shares insights for financial success. Active in seminars and philanthropy, Bibb aims to create a more financially informed society, driven by her passion for empowering others.