
What is Chi-Square Statistic?
The Chi-Square Statistic is a statistical test that is used to determine if there is a significant association between two categorical variables. It is often used to analyze data that is in the form of frequencies or counts, such as survey responses or the number of individuals in different categories.
The Chi-Square Statistic measures the difference between the observed frequencies and the expected frequencies under the assumption of independence between the variables. It calculates a test statistic, which follows a Chi-Square distribution, and compares it to a critical value to determine if the association between the variables is statistically significant.
The Chi-Square Statistic is widely used in various fields, such as social sciences, market research, and medical research. It can be used to test hypotheses about the relationship between variables, identify patterns or trends in data, and assess the goodness-of-fit of a model.
It is important to note that the Chi-Square Statistic is a non-parametric test, meaning that it does not make any assumptions about the distribution of the data. However, it does assume that the observations are independent and that the expected frequencies are reasonably large.
Examples of Chi-Square Statistic

The chi-square statistic is a commonly used statistical test that helps determine if there is a significant association between two categorical variables. It is often used to analyze data that is organized in a contingency table, which shows the frequency distribution of the variables being studied.
Example 1: Gender and Voting Preference
Suppose we want to investigate if there is a relationship between gender and voting preference in a certain election. We collect data from a random sample of 500 individuals and record their gender (male or female) and their voting preference (candidate A, candidate B, or undecided).
We can organize this data into a contingency table:
| Candidate A | Candidate B | Undecided | |
|---|---|---|---|
| Male | 120 | 100 | 30 |
| Female | 80 | 90 | 80 |
To determine if there is a significant association between gender and voting preference, we can use the chi-square test. The test will calculate the expected frequencies for each cell in the contingency table, assuming that there is no association between the variables. It will then compare the observed frequencies to the expected frequencies to determine if there is a significant difference.
Example 2: Educational Attainment and Employment Status
Another example where the chi-square statistic can be used is to analyze the relationship between educational attainment and employment status. Suppose we want to investigate if there is a relationship between these two variables in a certain population.
We collect data from a random sample of 1000 individuals and record their educational attainment (high school, college, or graduate degree) and their employment status (employed, unemployed, or not in the labor force).
We can organize this data into a contingency table:
| Employed | Unemployed | Not in the Labor Force | |
|---|---|---|---|
| High School | 300 | 100 | 200 |
| College | 400 | 50 | 100 |
| Graduate Degree | 200 | 30 | 20 |
Using the chi-square test, we can determine if there is a significant association between educational attainment and employment status. The test will compare the observed frequencies to the expected frequencies, assuming no association between the variables, to determine if there is a significant difference.
How and When to Use the Chi-Square Test
The chi-square test is a statistical test that is used to determine if there is a significant association between two categorical variables. It is commonly used in research and data analysis to examine the relationship between variables and to test hypotheses.
When to Use the Chi-Square Test

The chi-square test is appropriate to use when you have two categorical variables and you want to determine if there is a relationship between them. It can be used to test whether the observed frequencies of different categories in a sample differ significantly from the expected frequencies.
Some common scenarios where the chi-square test is used include:
- Testing the independence of two categorical variables: For example, you might want to determine if there is a relationship between gender and voting preference.
- Comparing observed and expected frequencies: This is useful when you want to compare the observed frequencies of different categories with the frequencies that would be expected if there was no relationship between the variables.
- Goodness-of-fit test: This test is used to determine if the observed frequencies in a sample match the frequencies that would be expected based on a theoretical distribution.
How to Use the Chi-Square Test
To perform a chi-square test, you first need to set up a contingency table that shows the observed frequencies of the different categories for each variable. Once you have the contingency table, you can calculate the chi-square statistic, which measures the difference between the observed and expected frequencies.
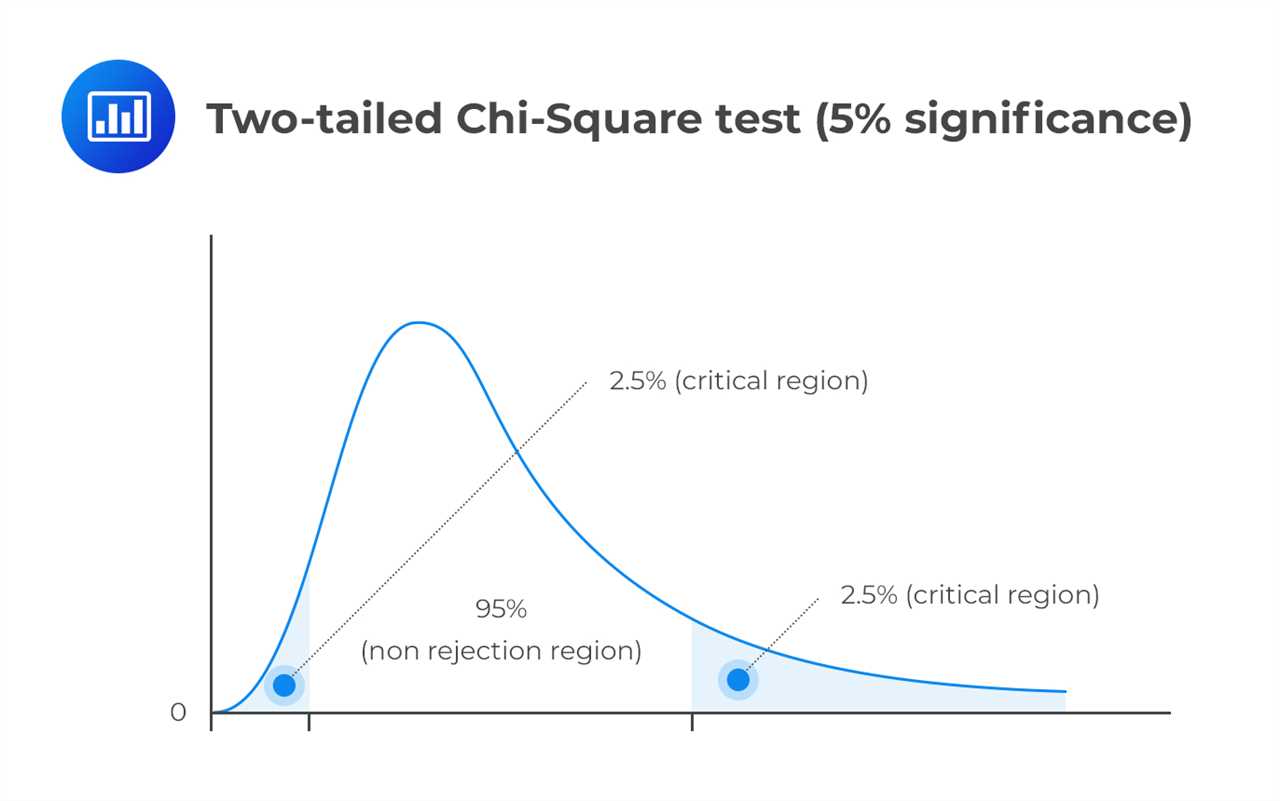
Next, you need to determine the degrees of freedom for the test. The degrees of freedom depend on the number of categories for each variable. You can then use a chi-square distribution table or a statistical software to find the critical value for the desired level of significance.
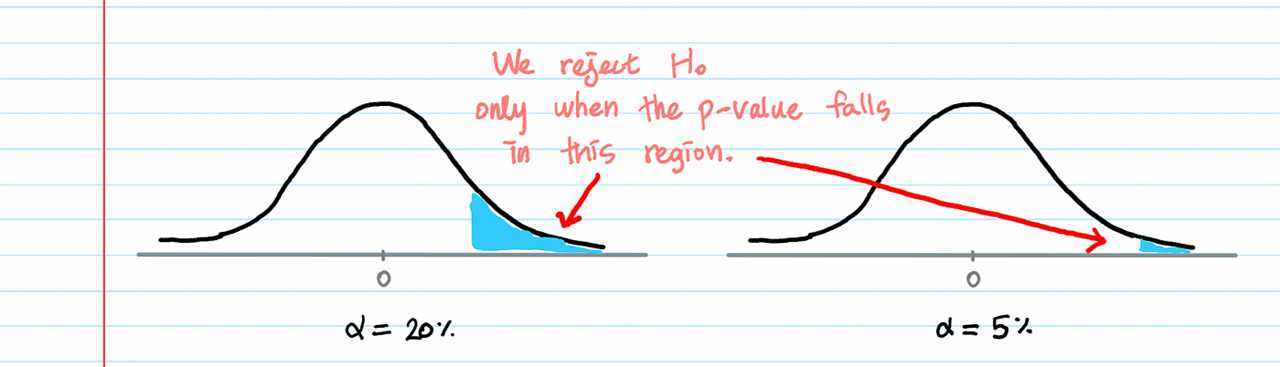
Finally, you compare the calculated chi-square statistic with the critical value. If the calculated chi-square statistic is greater than the critical value, you can reject the null hypothesis and conclude that there is a significant association between the variables.
It is important to note that the chi-square test assumes that the observations are independent and that the expected frequencies are not too small. If the expected frequencies are too small, the chi-square test may not be valid and alternative tests, such as Fisher’s exact test, should be used.

Emily Bibb simplifies finance through bestselling books and articles, bridging complex concepts for everyday understanding. Engaging audiences via social media, she shares insights for financial success. Active in seminars and philanthropy, Bibb aims to create a more financially informed society, driven by her passion for empowering others.