
What is Money Flow Index?
The Money Flow Index (MFI) is a technical indicator used in financial markets to measure the strength and momentum of money flowing in and out of a security or an asset. It is primarily used to identify overbought or oversold conditions in a market, and to determine potential trend reversals.
Definition and Calculation
The Money Flow Index is calculated using a combination of price and volume data. It takes into account the price of a security, the volume of trades, and the direction of the price movement. The formula for calculating the MFI is as follows:
The Money Ratio is calculated by dividing the Positive Money Flow (PMF) by the Negative Money Flow (NMF). The PMF is the sum of the money flow on days when the price increases, while the NMF is the sum of the money flow on days when the price decreases.
Interpreting Money Flow Index
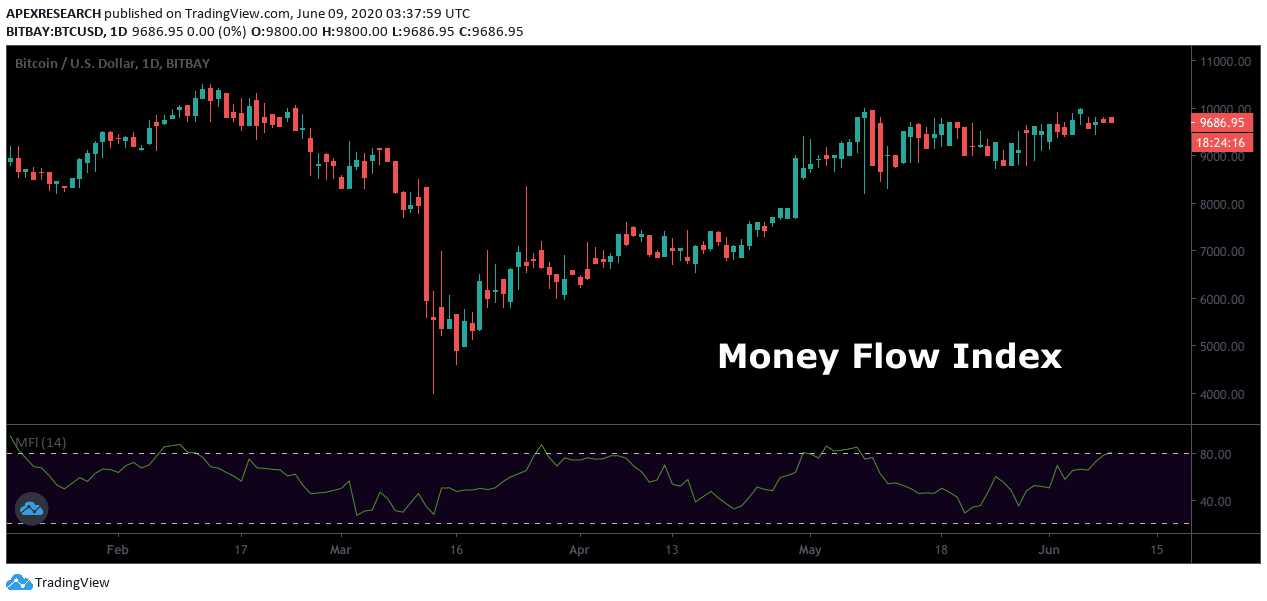
The Money Flow Index ranges from 0 to 100, with values above 80 indicating an overbought condition and values below 20 indicating an oversold condition. Traders often look for divergences between the MFI and the price of a security, as it can signal a potential trend reversal. For example, if the price of a security is making higher highs, but the MFI is making lower highs, it could indicate that buying pressure is weakening and a reversal may be imminent.
Uses of Money Flow Index
The Money Flow Index can be used in various ways by traders and investors. Some of the common uses include:
- Identifying overbought and oversold conditions
- Confirming trend reversals
- Generating buy and sell signals
- Confirming the strength of a trend
Traders often combine the MFI with other technical indicators or chart patterns to increase the accuracy of their trading decisions.
Limitations of Money Flow Index
While the Money Flow Index can be a useful tool, it is important to note its limitations. Like any technical indicator, it is not foolproof and can produce false signals. It should be used in conjunction with other indicators and analysis techniques to make informed trading decisions. Additionally, the MFI may not work well in certain market conditions, such as during periods of low volume or when there is a lack of price volatility.
Definition and Calculation
The Money Flow Index (MFI) is a technical indicator that measures the inflow and outflow of money into an asset over a specified period of time. It is used to determine the strength and direction of a price trend, as well as to identify potential reversals in the market.
To calculate the Money Flow Index, several steps are involved:
1. Typical Price
The first step is to calculate the typical price for each period, which is the average of the high, low, and closing prices. The formula is as follows:
Typical Price = (High + Low + Close) / 3
2. Money Flow
The next step is to calculate the money flow for each period, which is the product of the typical price and the volume. If the typical price is higher than the previous period’s typical price, it is considered positive money flow. If it is lower, it is considered negative money flow. The formula is as follows:
Positive Money Flow = Typical Price * Volume (if Typical Price > Previous Typical Price)
Negative Money Flow = Typical Price * Volume (if Typical Price < Previous Typical Price)
3. Money Ratio
The money ratio is calculated by dividing the sum of positive money flow over a specified period by the sum of negative money flow over the same period. The formula is as follows:
Money Ratio = Sum of Positive Money Flow / Sum of Negative Money Flow
4. Money Flow Index
Finally, the Money Flow Index is calculated by subtracting 100 from 100 divided by (1 + Money Ratio). The formula is as follows:
The resulting value of the Money Flow Index ranges from 0 to 100. A value above 80 is considered overbought, indicating a potential reversal to the downside. Conversely, a value below 20 is considered oversold, indicating a potential reversal to the upside.
The Money Flow Index is a useful tool for traders and investors to assess the strength and direction of a price trend. It can be used in conjunction with other technical indicators to confirm signals and make informed trading decisions.
Interpreting Money Flow Index
When analyzing the Money Flow Index (MFI), it is important to understand how to interpret the values and signals it provides. The MFI is a momentum indicator that measures the strength and direction of money flowing into or out of a security. It is calculated using both price and volume data.
Overbought and Oversold Levels
One way to interpret the MFI is by looking at overbought and oversold levels. When the MFI reaches a value above 80, it is considered overbought, indicating that the security may be due for a price correction or reversal. Conversely, when the MFI falls below 20, it is considered oversold, suggesting that the security may be due for a price rebound or reversal.
Divergence
Confirmation
Volume Analysis
In addition to interpreting the MFI itself, it is also important to consider volume analysis. When the MFI is rising and the volume is increasing, it suggests that the buying pressure is strong and the price is likely to continue to rise. Conversely, when the MFI is falling and the volume is decreasing, it suggests that the selling pressure is strong and the price is likely to continue to fall.
| MFI Value | Interpretation |
|---|---|
| Over 80 | Overbought |
| Below 20 | Oversold |
| Divergence | Potential reversal |
| Confirmation | Strength of trend |
| Volume Analysis | Buying or selling pressure |
Overall, the interpretation of the MFI should be done in conjunction with other technical analysis tools and indicators to get a more comprehensive view of the market conditions and potential trading opportunities.
Uses of Money Flow Index
The Money Flow Index (MFI) is a popular technical analysis tool used by traders and investors to identify potential buying and selling opportunities in the financial markets. Here are some of the main uses of the Money Flow Index:
1. Overbought and Oversold Conditions: The Money Flow Index can be used to identify overbought and oversold conditions in a particular security or market. When the MFI reaches a high level (typically above 80), it suggests that the security or market is overbought and may be due for a correction or reversal. Conversely, when the MFI reaches a low level (typically below 20), it indicates that the security or market is oversold and may be due for a bounce or rally.
2. Confirmation of Price Trends: The Money Flow Index can be used to confirm the strength of a price trend. If the MFI is rising along with an uptrend in prices, it suggests that buying pressure is increasing and the trend is likely to continue. Conversely, if the MFI is falling along with a downtrend in prices, it indicates that selling pressure is increasing and the trend is likely to continue.
3. Divergence Patterns: The Money Flow Index can help identify divergence patterns, which occur when the MFI and price of a security or market move in opposite directions. Bullish divergence occurs when the MFI makes higher lows while the price makes lower lows, indicating potential buying opportunities. Bearish divergence occurs when the MFI makes lower highs while the price makes higher highs, indicating potential selling opportunities.
4. Volume Confirmation: The Money Flow Index takes into account both price and volume data, making it a useful tool for confirming the strength of a price move. If the MFI is rising along with increasing volume, it suggests that the buying pressure is strong and the price move is likely to be sustainable. Conversely, if the MFI is falling along with decreasing volume, it indicates that the selling pressure is weak and the price move may not be sustainable.
5. Trading Signals: Traders often use the Money Flow Index to generate trading signals. For example, a trader may enter a long position when the MFI crosses above a certain threshold (e.g., 80) and exit the position when the MFI crosses below another threshold (e.g., 20). These thresholds can be adjusted based on the trader’s risk tolerance and the specific security or market being traded.
6. Risk Management: The Money Flow Index can also be used as a tool for risk management. Traders and investors can use the MFI to assess the strength of a price move and adjust their position sizes accordingly. For example, if the MFI is indicating a strong buying pressure, a trader may decide to increase their position size to take advantage of the potential upside. Conversely, if the MFI is indicating a weak buying pressure, a trader may decide to reduce their position size or exit the trade altogether to limit their losses.
Overall, the Money Flow Index is a versatile technical analysis tool that can be used in various ways to enhance trading and investment decisions. However, like any indicator, it is not foolproof and should be used in conjunction with other technical analysis tools and fundamental analysis to make well-informed trading decisions.
Limitations of Money Flow Index
The Money Flow Index (MFI) is a popular technical analysis tool used by traders and investors to measure the strength and momentum of a stock or market. While the MFI can provide valuable insights, it is important to understand its limitations in order to make informed trading decisions.
1. False Signals
One of the main limitations of the MFI is that it can generate false signals, leading to incorrect trading decisions. The MFI is based on the concept of money flow, which measures the buying and selling pressure in a stock or market. However, it is important to note that the MFI is a lagging indicator, meaning that it may not accurately reflect the current market conditions. Traders should be cautious when relying solely on the MFI for trading decisions and consider using it in conjunction with other technical indicators.
2. Sensitivity to Price Volatility
Another limitation of the MFI is its sensitivity to price volatility. The MFI calculates the money flow ratio by dividing the positive money flow by the negative money flow and then normalizing the result between 0 and 100. However, in highly volatile markets, the MFI may produce erratic readings, making it difficult to interpret the signals accurately. Traders should be aware of this limitation and consider adjusting their trading strategies accordingly.
3. Lack of Context
4. Limited Application
The MFI is primarily designed for analyzing individual stocks or markets and may not be suitable for analyzing other types of assets, such as commodities or currencies. Traders should consider using other technical indicators that are specifically tailored to the asset class they are trading.
5. Subjectivity
Like any technical analysis tool, the interpretation of the MFI is subjective and can vary among traders. Different traders may have different thresholds for overbought or oversold conditions, leading to conflicting signals. Traders should develop their own trading strategies and rules based on their risk tolerance and trading style.
| Limitations of Money Flow Index |
|---|
| False Signals |
| Sensitivity to Price Volatility |
| Lack of Context |
| Limited Application |
| Subjectivity |

Emily Bibb simplifies finance through bestselling books and articles, bridging complex concepts for everyday understanding. Engaging audiences via social media, she shares insights for financial success. Active in seminars and philanthropy, Bibb aims to create a more financially informed society, driven by her passion for empowering others.