
Elliott Wave Theory Explained: A Comprehensive Guide for Traders
The Elliott Wave Theory is a popular technical analysis tool used by traders to forecast future price movements in financial markets. Developed by Ralph Nelson Elliott in the 1930s, this theory is based on the idea that market prices follow repetitive patterns, which can be identified and used to predict future price movements.
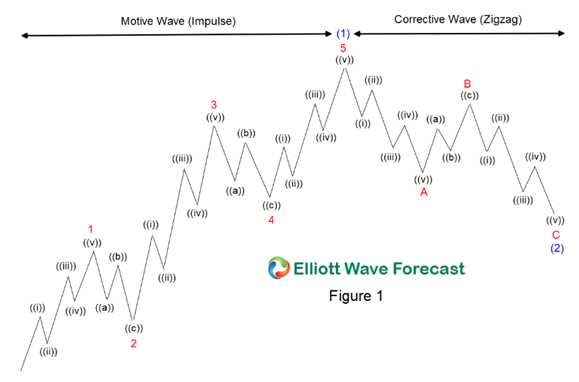
At its core, the Elliott Wave Theory suggests that market prices move in a series of waves, consisting of impulsive waves and corrective waves. Impulsive waves are the main trend moves, while corrective waves are the counter-trend moves that occur in between. These waves can be further divided into smaller sub-waves, creating a fractal-like pattern.
To apply the Elliott Wave Theory, traders use a combination of wave counting, Fibonacci ratios, and trend analysis. Wave counting involves identifying and labeling the different waves within a price chart, while Fibonacci ratios are used to determine potential price targets and support/resistance levels. Trend analysis helps traders determine the overall direction of the market.
One of the key concepts in the Elliott Wave Theory is the concept of wave degrees. Waves can be classified into different degrees, ranging from the largest degree (Grand Supercycle) to the smallest degree (Subminuette). Each degree represents a different time frame and magnitude of price movement.
While the Elliott Wave Theory can be a powerful tool for traders, it is important to note that it is not without its limitations. One of the main challenges in using this theory is the subjective nature of wave counting. Different traders may interpret the waves differently, leading to conflicting analysis and predictions. Additionally, the Elliott Wave Theory does not provide specific entry and exit points, leaving room for interpretation and potential errors.
Elliott Wave Theory is a popular technical analysis tool used by traders to forecast future price movements in financial markets. Developed by Ralph Nelson Elliott in the 1930s, this theory is based on the idea that market prices follow repetitive patterns, which can be identified and used to make trading decisions.
Key Concepts of Elliott Wave Theory
Elliott Wave Theory is built upon several key concepts:
- Wave Principle: The Wave Principle states that market prices move in a series of repetitive patterns, consisting of waves. These waves can be subdivided into smaller waves, creating a fractal-like structure.
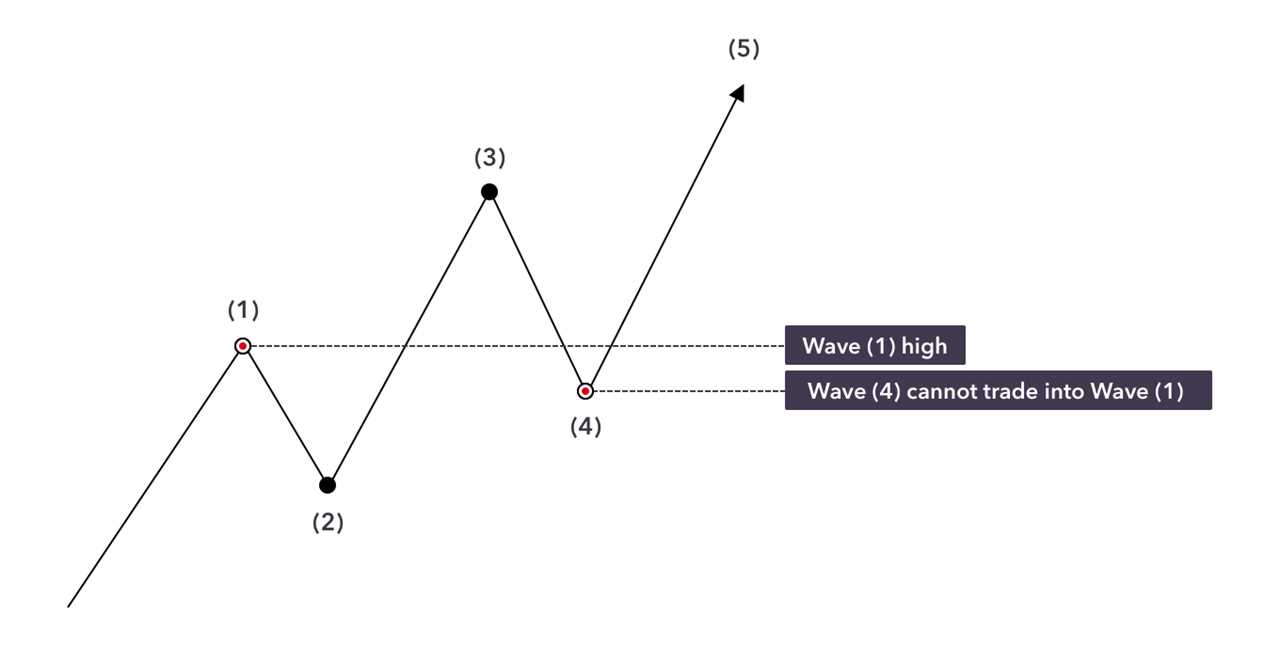
- Impulse Waves: Impulse waves are the main directional waves in Elliott Wave Theory. They consist of five waves, labeled as 1, 2, 3, 4, and 5. Waves 1, 3, and 5 move in the direction of the primary trend, while waves 2 and 4 are corrective waves.
- Corrective Waves: Corrective waves are counter-trend waves that move against the primary trend. They consist of three waves, labeled as A, B, and C. Wave A is a correction of the previous impulse wave, wave B is a correction of wave A, and wave C is the final wave that completes the correction.
- Fibonacci Ratios: Elliott Wave Theory utilizes Fibonacci ratios to determine the potential price targets and retracement levels of waves. The most commonly used ratios are 0.618, 0.382, and 1.618.
How to Identify Elliott Waves
Identifying Elliott Waves requires a combination of technical analysis tools and pattern recognition. Traders typically use price charts, trend lines, and oscillators to identify the different waves and their corresponding patterns.
The process of identifying Elliott Waves involves:
- Identifying the start of a new impulse wave or corrective wave.
- Counting the sub-waves within the larger wave structure.
- Applying Fibonacci ratios to determine potential price targets and retracement levels.
- Confirming the wave count with other technical indicators and patterns.
Limitations and Challenges
While Elliott Wave Theory can be a powerful tool for traders, it is not without its limitations and challenges. Some of the common pitfalls include:
- Subjectivity: Identifying and labeling waves can be subjective, as different traders may interpret the patterns differently.
- False Signals: Like any technical analysis tool, Elliott Wave Theory is not foolproof and can generate false signals. Traders should always use additional confirmation indicators and risk management strategies.
Conclusion
Applying Elliott Wave Theory in Technical Analysis
The impulse waves, labeled as waves 1, 3, and 5, represent the main trend and move in the direction of the overall market sentiment. These waves are typically characterized by strong price movements and are where traders can find opportunities to enter trades in the direction of the trend.
The corrective waves, labeled as waves 2 and 4, represent temporary counter-trend movements. These waves move against the main trend and are typically characterized by smaller price movements. Traders can use these waves to identify potential areas of support or resistance and adjust their trading strategies accordingly.
Applying Elliott Wave Theory in Technical Analysis
Once the basics of Elliott Wave Theory are understood, traders can begin applying it in their technical analysis. One common approach is to use Fibonacci retracement levels to identify potential areas of support or resistance within the waves.
Traders can draw Fibonacci retracement levels from the start of wave 1 to the end of wave 5 to identify potential areas where the price may retrace before continuing in the direction of the trend. These retracement levels, such as 38.2% or 61.8%, can act as support or resistance levels where traders can look for potential entry or exit points.
In addition to Fibonacci retracement levels, traders can also use other technical indicators, such as moving averages or oscillators, to confirm the signals provided by Elliott Wave Theory. For example, if wave 3 is the longest and strongest wave, traders can look for confirmation from other indicators that the trend is indeed strong and likely to continue.
Using Elliott Wave Theory in Trading Strategies
Once traders have identified potential areas of support or resistance using Elliott Wave Theory, they can incorporate this information into their trading strategies. For example, if the price retraces to a Fibonacci retracement level and shows signs of reversal, traders can look for confirmation signals, such as a bullish candlestick pattern or a bullish divergence on an oscillator, to enter a long trade.
On the other hand, if the price reaches a Fibonacci retracement level and shows signs of rejection, traders can look for confirmation signals, such as a bearish candlestick pattern or a bearish divergence on an oscillator, to enter a short trade.
Conclusion
| Advantages | Challenges |
|---|---|
| – Helps identify trends | – Subjective interpretation |
| – Predicts future price movements | – Requires practice and experience |
| – Provides potential entry and exit points | – Can be time-consuming |
Advanced Concepts and Strategies for Trading with Elliott Wave Theory

1. Fibonacci Retracement Levels
One of the key concepts in Elliott Wave Theory is the use of Fibonacci retracement levels. These levels are based on the Fibonacci sequence, a mathematical pattern that is found in nature and often observed in financial markets. By using Fibonacci retracement levels, traders can identify potential support and resistance levels in a market.
For example, if a market is in an uptrend, a trader can use Fibonacci retracement levels to identify potential areas of support where the price may bounce back up. Conversely, if a market is in a downtrend, Fibonacci retracement levels can be used to identify potential areas of resistance where the price may reverse and continue to move lower.
2. Wave Extensions
Another advanced concept in Elliott Wave Theory is the use of wave extensions. Wave extensions occur when a wave within the Elliott Wave pattern extends beyond the expected length. This can indicate a strong trend and provide an opportunity for traders to enter or exit positions.
Traders can identify wave extensions by measuring the length of previous waves and comparing them to the length of the current wave. If the current wave is significantly longer than the previous waves, it may be a wave extension. Traders can then use this information to adjust their trading strategy accordingly.
3. Wave Relationships
For example, one common relationship is the 5-3 relationship, where a five-wave impulse wave is followed by a three-wave corrective wave. This pattern often repeats itself in the market, and traders can use this knowledge to anticipate future price movements.
4. Confirmation with Other Indicators
While Elliott Wave Theory can be a powerful tool on its own, it is often beneficial to confirm its signals with other technical indicators. By combining Elliott Wave analysis with other indicators such as moving averages, oscillators, or volume indicators, traders can increase the accuracy of their predictions.
For example, if Elliott Wave analysis suggests that a market is in an uptrend, a trader can look for confirmation from other indicators such as a rising moving average or increasing volume. This can provide additional confidence in the analysis and increase the likelihood of a successful trade.
Common Pitfalls and Challenges in Using Elliott Wave Theory
While Elliott Wave Theory can be a powerful tool for technical analysis, it is not without its challenges and potential pitfalls. Traders should be aware of these factors when using this theory to inform their trading decisions.
1. Subjectivity: One of the main challenges of Elliott Wave Theory is its subjectivity. Identifying and labeling wave patterns can be subjective, as different traders may interpret the waves differently. This subjectivity can lead to different wave counts and potentially conflicting trading signals.
3. False Signals: Like any technical analysis tool, Elliott Wave Theory is not foolproof and can generate false signals. It is essential to validate wave patterns with other technical indicators or analysis techniques to increase the accuracy of trading signals. Relying solely on Elliott Wave Theory may result in erroneous trading decisions.
4. Timeframe Dependence: Elliott Wave Theory is highly dependent on the timeframe being analyzed. Different timeframes can produce different wave patterns, leading to conflicting signals. Traders should consider multiple timeframes and analyze the waves in conjunction with other technical indicators to gain a more comprehensive view of the market.
5. Market Noise: The presence of market noise, such as random price fluctuations and news events, can disrupt the smooth progression of wave patterns. It can be challenging to distinguish between genuine wave patterns and noise-induced price movements. Traders should exercise caution and use additional analysis techniques to filter out market noise.
6. Emotional Bias: Traders may develop emotional biases when using Elliott Wave Theory, leading to irrational trading decisions. It is crucial to remain objective and not let personal biases influence trading strategies. Implementing strict risk management techniques can help mitigate the impact of emotional biases.

Emily Bibb simplifies finance through bestselling books and articles, bridging complex concepts for everyday understanding. Engaging audiences via social media, she shares insights for financial success. Active in seminars and philanthropy, Bibb aims to create a more financially informed society, driven by her passion for empowering others.