
Leptokurtic Distributions: Definition, Example, Comparison with Platykurtic
A leptokurtic distribution is a statistical term used to describe a probability distribution that has a higher peak and heavier tails compared to a normal distribution. This means that the data in a leptokurtic distribution has a higher concentration around the mean and more extreme values compared to a normal distribution.
Definition of Leptokurtic Distributions
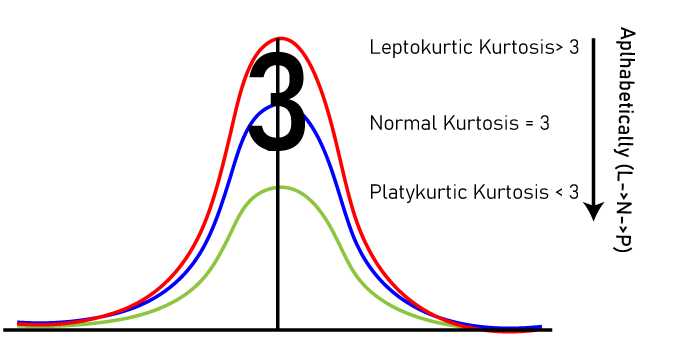
Leptokurtic distributions are characterized by their kurtosis, which measures the shape of the distribution’s tails. Kurtosis is a statistical measure that quantifies the heaviness of the tails relative to a normal distribution. A leptokurtic distribution has positive kurtosis, indicating that it has fatter tails and a higher peak compared to a normal distribution.
Leptokurtic distributions can be found in various fields, including finance, economics, and risk analysis. They are often used to model extreme events or outliers that occur more frequently than would be expected in a normal distribution.
Example of Leptokurtic Distribution
Another example of a leptokurtic distribution is the distribution of insurance claims. Insurance claims data often exhibits a higher concentration of small claims and a higher frequency of large claims compared to a normal distribution. This is due to the nature of insurance, where most claims are small but occasionally there are large catastrophic events that result in a higher number of large claims.
Comparison with Platykurtic Distributions
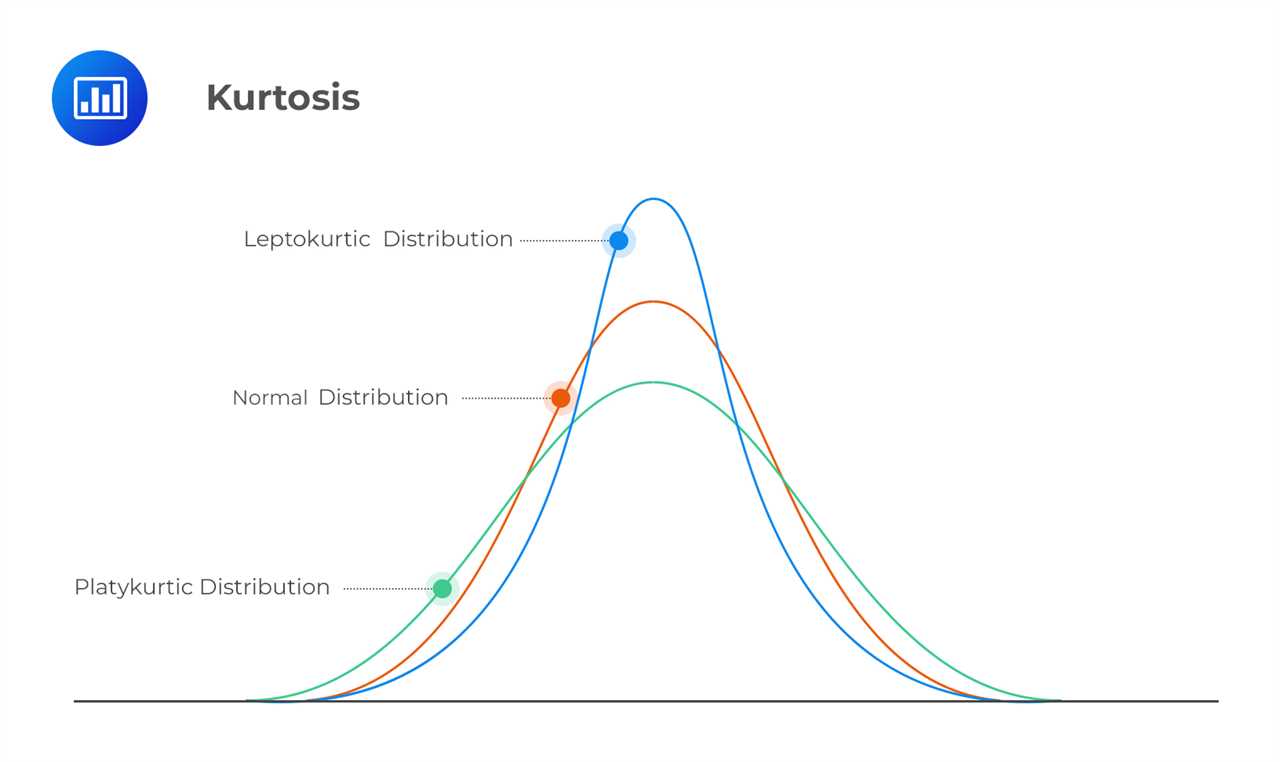
Leptokurtic distributions are the opposite of platykurtic distributions, which have thinner tails and a flatter peak compared to a normal distribution. While leptokurtic distributions have a higher concentration of data around the mean and more extreme values, platykurtic distributions have a lower concentration of data around the mean and fewer extreme values.
The choice between a leptokurtic or platykurtic distribution depends on the specific characteristics of the data being analyzed. Leptokurtic distributions are often used when modeling extreme events or outliers, while platykurtic distributions are used when the data is more evenly distributed and lacks extreme values.
What are Leptokurtic Distributions?
A leptokurtic distribution is a statistical term used to describe a probability distribution that has a higher peak and heavier tails compared to a normal distribution. In other words, it is a distribution that has more extreme values and less values in the middle.
Leptokurtic distributions are characterized by their kurtosis, which is a measure of the distribution’s tail heaviness. A distribution with positive kurtosis is considered leptokurtic, while a distribution with negative kurtosis is considered platykurtic.
Leptokurtic distributions can be found in various fields, including finance, economics, and biology. In finance, for example, stock returns are often found to follow a leptokurtic distribution due to the presence of extreme events such as market crashes. In biology, the distribution of body sizes in a population can also exhibit leptokurtic characteristics.
Compared to platykurtic distributions, leptokurtic distributions have fatter tails, which means they have a higher probability of extreme values occurring. This can have implications for risk management and decision-making, as extreme events are more likely to occur in leptokurtic distributions.
To better understand leptokurtic distributions, it is helpful to compare them with other types of distributions. For example, a leptokurtic distribution can be contrasted with a normal distribution, which has a kurtosis of zero and represents a symmetrical bell-shaped curve. By comparing different types of distributions, researchers can gain insights into the underlying characteristics of the data and make more informed decisions.
Example of Leptokurtic Distribution
A leptokurtic distribution is a statistical distribution that has a higher peak and fatter tails compared to a normal distribution. It is characterized by a higher concentration of data points around the mean and a higher likelihood of extreme values.
Let’s consider an example to understand leptokurtic distributions better. Suppose we are analyzing the returns of a stock over a period of time. We collect the daily returns and plot a histogram to visualize the distribution.
Upon plotting the histogram, we observe that the distribution of returns has a higher peak and fatter tails compared to a normal distribution. This indicates that the stock’s returns have a leptokurtic distribution.
Why is this important? A leptokurtic distribution implies that there is a higher probability of extreme events occurring. In the case of stock returns, this means that there is a higher likelihood of experiencing large gains or losses.
Investors and analysts need to be aware of the leptokurtic nature of the distribution as it can impact risk assessment and portfolio management strategies. The presence of extreme events can lead to higher volatility and potential losses, which need to be accounted for in risk models and investment decisions.
Comparison of Leptokurtic and Platykurtic Distributions
Leptokurtic Distributions
A leptokurtic distribution is characterized by a higher peak and heavier tails compared to a normal distribution. This means that the data in a leptokurtic distribution have a higher concentration around the mean and a higher likelihood of extreme values compared to a normal distribution.
Leptokurtic distributions are often observed in financial markets, where extreme events such as market crashes or booms can occur. These distributions indicate a higher level of volatility and risk in the market.
Platykurtic Distributions
On the other hand, a platykurtic distribution is characterized by a flatter peak and lighter tails compared to a normal distribution. This means that the data in a platykurtic distribution have a lower concentration around the mean and a lower likelihood of extreme values compared to a normal distribution.
Platykurtic distributions are often observed in stable and less volatile markets. These distributions indicate a lower level of volatility and risk compared to leptokurtic distributions.
Now let’s compare the characteristics of leptokurtic and platykurtic distributions:
- Leptokurtic distributions have a higher peak, while platykurtic distributions have a flatter peak.
- Leptokurtic distributions have heavier tails, indicating a higher likelihood of extreme values, while platykurtic distributions have lighter tails, indicating a lower likelihood of extreme values.
- Leptokurtic distributions have a higher level of volatility and risk, while platykurtic distributions have a lower level of volatility and risk.

Emily Bibb simplifies finance through bestselling books and articles, bridging complex concepts for everyday understanding. Engaging audiences via social media, she shares insights for financial success. Active in seminars and philanthropy, Bibb aims to create a more financially informed society, driven by her passion for empowering others.