
Probability Distribution Explained
Probability distribution is a concept used in statistics and probability theory to describe the likelihood of different outcomes in a given set of events or experiments. It provides a mathematical representation of the probabilities associated with each possible outcome.
A probability distribution is typically represented in the form of a table, graph, or equation. It shows the probabilities of all possible outcomes, with the sum of the probabilities equaling 1. The shape of the distribution can vary depending on the nature of the data and the underlying probability model.
Types of Probability Distribution
There are several types of probability distributions, each with its own characteristics and applications. Some common types include:
| Distribution | Description | Application |
|---|---|---|
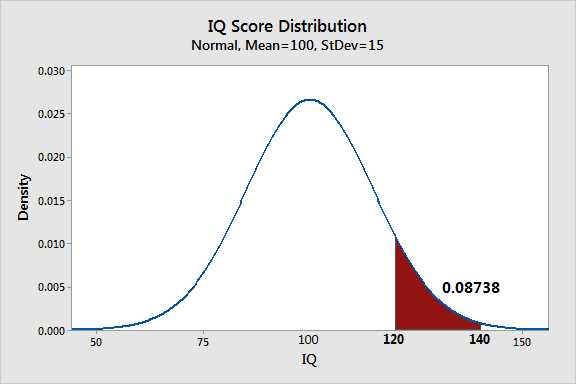
| Normal Distribution | A symmetric distribution with a bell-shaped curve | Used to model many natural phenomena |
| Binomial Distribution | A discrete distribution representing the number of successes in a fixed number of independent Bernoulli trials | Used in analyzing binary outcomes |
| Poisson Distribution | A discrete distribution representing the number of events occurring in a fixed interval of time or space | Used in analyzing rare events |
These are just a few examples, and there are many other types of probability distributions that can be used depending on the specific situation and data being analyzed.
Uses of Probability Distribution in Investing
In investing, probability distribution can be used in various ways to assess risk and make investment decisions. Some common uses include:
- Calculating the expected return and standard deviation of an investment portfolio
- Assessing the probability of different investment outcomes
- Determining the optimal asset allocation based on risk and return objectives
- Evaluating the risk-reward tradeoff of different investment strategies
By using probability distribution analysis, investors can gain insights into the potential range of outcomes and make more informed decisions about their investments.
At its core, probability distribution represents the probability of each possible value or range of values that a random variable can take. A random variable is a variable whose value is determined by chance or randomness. It can be discrete, taking on a finite or countable number of values, or continuous, taking on any value within a certain range.
There are various types of probability distributions, each with its own characteristics and applications. Some of the most common ones include the normal distribution, binomial distribution, Poisson distribution, and exponential distribution. These distributions are often used to model real-world phenomena and make predictions based on observed data.
Properties of Probability Distribution
Probability distributions have several key properties that help us understand and analyze data:
- Probability Density Function (PDF): The PDF defines the probability of a random variable taking on a specific value or falling within a certain range. It provides a mathematical formula or equation that describes the shape of the distribution.
- Cumulative Distribution Function (CDF): The CDF gives the probability that a random variable is less than or equal to a specific value. It provides a cumulative view of the probabilities associated with each value or range.
- Variance: The variance measures the spread or dispersion of a probability distribution. It quantifies how much the values of a random variable deviate from the mean.
Applications of Probability Distribution
Probability distribution has numerous applications in various fields, including finance and investing. It allows investors to assess and quantify the risks associated with different investment options and make informed decisions.
In addition, probability distribution is essential in risk analysis and Monte Carlo simulations, where multiple scenarios are simulated to assess the potential outcomes of an investment or project. By incorporating probability distributions into these simulations, investors can evaluate the range of possible outcomes and make more informed decisions.
Types of Probability Distribution
1. Normal Distribution
2. Binomial Distribution
The binomial distribution is used to model the number of successes in a fixed number of independent Bernoulli trials, where each trial has only two possible outcomes: success or failure. It is characterized by two parameters: the number of trials and the probability of success in each trial. The binomial distribution is commonly used in investing to model the probability of a stock going up or down, or the probability of a certain event occurring.
3. Poisson Distribution
The Poisson distribution is used to model the number of events that occur in a fixed interval of time or space, given the average rate of occurrence. It is characterized by a single parameter, which is the average rate of occurrence. The Poisson distribution is often used in investing to model the number of trades executed in a given time period or the number of customer arrivals at a store.
4. Exponential Distribution
The exponential distribution is used to model the time between events in a Poisson process, where events occur continuously and independently at a constant average rate. It is characterized by a single parameter, which is the average rate of occurrence. The exponential distribution is commonly used in investing to model the time between stock price changes or the time between trades.
5. Uniform Distribution
The uniform distribution is used to model random variables that have a constant probability over a specified range. It is characterized by two parameters: the minimum and maximum values of the range. The uniform distribution is often used in investing to model the random fluctuations of stock prices within a certain range or the random arrival times of customers at a store.
Uses of Probability Distribution in Investing
Probability distribution is a powerful tool that is widely used in investing to analyze and understand the potential outcomes of various investment strategies. By using probability distribution, investors can assess the likelihood of different investment returns and make informed decisions based on the risk and reward associated with each investment option.
1. Risk Management
Probability distribution helps investors in managing risk effectively. By analyzing the probability distribution of investment returns, investors can identify the potential downside risks and take appropriate measures to mitigate them. This may involve diversifying the investment portfolio, setting stop-loss orders, or using hedging strategies to protect against adverse market movements.
2. Portfolio Optimization
Probability distribution is also used in portfolio optimization, which involves constructing an investment portfolio that maximizes returns while minimizing risks. By analyzing the probability distribution of different asset classes and their correlations, investors can determine the optimal allocation of their investments to achieve the desired risk-return tradeoff. This helps in creating a well-diversified portfolio that is resilient to market fluctuations.
3. Performance Evaluation
Probability distribution is used to evaluate the performance of investment strategies and funds. By comparing the actual investment returns with the expected returns based on the probability distribution, investors can assess the effectiveness of their investment decisions. This helps in identifying the strengths and weaknesses of different investment strategies and making necessary adjustments to improve performance.
4. Option Pricing
5. Risk Assessment
Probability distribution is used to assess the overall risk of an investment portfolio. By analyzing the probability distribution of portfolio returns, investors can determine the potential downside risks and measure the portfolio’s volatility. This information is crucial in determining the appropriate level of risk for an investor’s risk tolerance and in designing an investment strategy that aligns with their financial goals.
| Benefits of Using Probability Distribution in Investing |
|---|
| 1. Provides a quantitative framework for analyzing investment risks and returns. |
| 2. Helps in making informed investment decisions based on the probability of different outcomes. |
| 3. Enables investors to optimize their portfolios and achieve the desired risk-return tradeoff. |
| 4. Facilitates the evaluation of investment performance and the identification of areas for improvement. |
| 5. Assists in pricing options and implementing hedging strategies. |
| 6. Provides a comprehensive assessment of the overall risk of an investment portfolio. |

Emily Bibb simplifies finance through bestselling books and articles, bridging complex concepts for everyday understanding. Engaging audiences via social media, she shares insights for financial success. Active in seminars and philanthropy, Bibb aims to create a more financially informed society, driven by her passion for empowering others.