
What is Herrick Payoff Index?
The Herrick Payoff Index (HPI) is a technical indicator that helps traders analyze the potential profitability of a trade. It was developed by John Herrick, a trader and author, and is commonly used in the field of technical analysis.
The HPI is designed to measure the strength of a trend by taking into account the volume, open interest, and price movement of a particular financial instrument. It is often used in futures trading, but can also be applied to other markets such as stocks and commodities.
By calculating the HPI, traders can gain insights into the overall market sentiment and make more informed trading decisions. It helps identify whether a trend is gaining or losing momentum, which can be useful for determining entry and exit points.
How does Herrick Payoff Index work?
The HPI is calculated using a formula that takes into account three main components: price, volume, and open interest. The formula is as follows:
HPI = (Price Change / Price Range) x Volume x Open Interest
The price change is calculated by subtracting the previous day’s closing price from the current day’s closing price. The price range is the difference between the highest and lowest prices during the same period.
The volume represents the number of contracts or shares traded during the period, while the open interest refers to the total number of outstanding contracts or shares.
By multiplying these three components together, the HPI provides a single value that indicates the potential profitability of a trade. A positive HPI suggests a bullish trend, while a negative HPI indicates a bearish trend.
Traders can use the HPI in conjunction with other technical indicators to confirm or validate their trading strategies. It can be plotted on a chart alongside price and volume data to visually analyze the relationship between the HPI and the market trend.
Overall, the Herrick Payoff Index is a valuable tool for traders looking to assess the strength and direction of a trend. It provides a quantitative measure of market sentiment and can help improve trading performance.
Herrick Payoff Index: Functionality
The Herrick Payoff Index (HPI) is a technical analysis indicator that is used to measure the strength and direction of trends in the financial markets. It was developed by John Herrick, an American economist, in the 1970s. The HPI is primarily used by traders and investors to identify potential trading opportunities and make informed decisions about buying or selling assets.
Calculation

The Herrick Payoff Index is calculated using three main components: price, volume, and open interest. The formula for calculating the HPI is as follows:
HPI = (Price Change / Volatility) * Volume
Price Change: The difference between the current price and the previous price.
Volatility: A measure of the price movement over a specific period of time.
Volume: The number of shares or contracts traded during a given period.
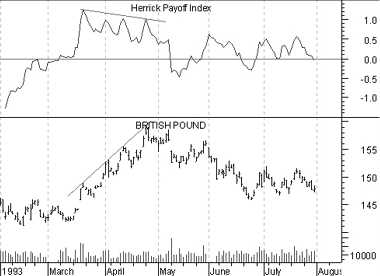
The HPI is typically displayed as a line chart that fluctuates above and below a zero line. Positive values indicate bullish trends, while negative values indicate bearish trends. Traders can use the HPI to identify potential trend reversals or confirm the strength of an existing trend.
Interpretation
When the HPI is above zero, it suggests that buying pressure is increasing and the market is experiencing a bullish trend. Traders may consider entering long positions or holding onto existing positions to take advantage of the upward momentum.
Conversely, when the HPI is below zero, it indicates that selling pressure is increasing and the market is in a bearish trend. Traders may consider shorting the market or liquidating their long positions to avoid potential losses.
It is important to note that the HPI is not a standalone indicator and should be used in conjunction with other technical analysis tools to make well-informed trading decisions. Traders should also consider the overall market conditions, news events, and other factors that may impact the price and volume of the asset being traded.
Limitations
While the Herrick Payoff Index can be a useful tool for traders, it does have some limitations. Firstly, it is based on historical data and may not accurately predict future price movements. Traders should use it as a supplementary tool rather than relying solely on its signals.
Additionally, the HPI may generate false signals or provide conflicting information during periods of low volume or high volatility. Traders should exercise caution and consider other indicators or market factors before making trading decisions based solely on the HPI.
How does Herrick Payoff Index work?
The Herrick Payoff Index (HPI) is a technical analysis indicator that helps traders identify and measure the strength of price trends in the financial markets. It combines price, volume, and open interest data to provide a comprehensive view of market sentiment and potential price movements.
The HPI calculates the difference between the current price and the previous day’s price, and then multiplies it by the volume and open interest. This calculation is done for a specified number of periods, usually 14 days. The resulting values are then summed up to create the HPI line.
The HPI line can be positive or negative, indicating whether the market is bullish or bearish. A positive HPI suggests that buyers are in control and price is likely to rise, while a negative HPI suggests that sellers are in control and price is likely to fall.
Traders can use the HPI to confirm trends, identify potential reversals, and generate buy or sell signals. When the HPI line crosses above zero, it is considered a bullish signal, indicating that it may be a good time to buy. Conversely, when the HPI line crosses below zero, it is considered a bearish signal, indicating that it may be a good time to sell.
In addition to the HPI line, the indicator also includes a signal line, which is a moving average of the HPI line. The signal line helps smooth out the fluctuations in the HPI line and provides a more reliable indication of market trends.
It is important to note that the HPI is not a standalone indicator and should be used in conjunction with other technical analysis tools and indicators to make more informed trading decisions. It is also recommended to backtest the HPI and adjust the parameters to suit the specific market and trading strategy.
| Advantages | Disadvantages |
|---|---|
| – Provides a comprehensive view of market sentiment | – May generate false signals in choppy or sideways markets |
| – Helps confirm trends and identify potential reversals | – Relies on accurate and reliable price, volume, and open interest data |
| – Can be used in conjunction with other technical analysis tools | – Requires customization and parameter adjustment for optimal performance |
| – Provides buy and sell signals |
Herrick Payoff Index: Advantages
The Herrick Payoff Index (HPI) is a technical analysis indicator that helps traders and investors assess the potential profitability of a trade or investment. It provides valuable insights into the market sentiment and can be used to make informed trading decisions. Here are some advantages of using the Herrick Payoff Index:
1. Market Sentiment Analysis
The HPI is designed to measure the market sentiment by analyzing the relationship between price, volume, and open interest. It helps traders identify whether the market is bullish or bearish, which can be useful in determining the direction of future price movements.
2. Early Warning System
The HPI can act as an early warning system for potential trend reversals or market turning points. By analyzing the changes in the HPI values, traders can anticipate shifts in market sentiment and adjust their trading strategies accordingly.
3. Confirmation Tool
The HPI can be used as a confirmation tool to validate other technical indicators or trading signals. By comparing the HPI readings with other indicators, traders can increase the reliability of their trading decisions and reduce the risk of false signals.
4. Versatility

The HPI can be applied to various financial markets, including stocks, commodities, and futures. It can be used in different timeframes, from intraday trading to long-term investing, making it a versatile tool for traders and investors with different trading styles.
5. Easy Interpretation
The HPI is relatively easy to interpret, even for novice traders. It uses a simple formula to calculate the index value, and the interpretation is straightforward. Traders can easily understand whether the HPI is indicating a bullish or bearish market sentiment.
6. Objective Analysis
The HPI provides an objective analysis of the market sentiment based on the relationship between price, volume, and open interest. It eliminates the emotional biases that can affect traders’ decisions and allows for a more objective assessment of the market conditions.
Benefits of using Herrick Payoff Index
The Herrick Payoff Index (HPI) is a technical indicator that can provide traders with valuable insights into market trends and potential trading opportunities. By analyzing the relationship between price, volume, and open interest, the HPI can help traders make more informed decisions and improve their trading strategies. Here are some of the benefits of using the Herrick Payoff Index:
1. Identifying Trend Reversals
One of the key benefits of the HPI is its ability to identify trend reversals in the market. By analyzing the changes in the HPI line, traders can determine when the market sentiment is shifting from bullish to bearish or vice versa. This can be particularly useful for swing traders and trend followers who aim to capture major market moves.
2. Confirming Price Movements
3. Assessing Market Strength
Another benefit of the HPI is its ability to assess the strength of the market. By analyzing the magnitude of the HPI line, traders can determine whether the market is in a strong or weak position. A high HPI value indicates that the market is trending strongly, while a low HPI value suggests that the market is range-bound or consolidating. This information can be valuable for traders looking to enter or exit positions.
4. Filtering Trading Signals
The HPI can also be used as a filter for trading signals. By combining the HPI with other technical indicators or trading strategies, traders can increase the accuracy of their signals and reduce the number of false signals. For example, a trader may only take buy signals when the HPI is above a certain threshold, or only take sell signals when the HPI is below a certain threshold. This filtering can help traders avoid entering trades that have a higher probability of failure.
Herrick Payoff Index: Disadvantages
The Herrick Payoff Index is a popular technical indicator used in trading to determine the potential profitability of a trade. While it offers several advantages, it also has some disadvantages that traders should be aware of.
3. Lagging Indicator: The Herrick Payoff Index is a lagging indicator, meaning it relies on past price data to generate signals. This can result in delayed entry or exit points, causing traders to miss out on potential profits or incur unnecessary losses.
4. False Signals: Like any technical indicator, the Herrick Payoff Index is not foolproof and can generate false signals. Traders should exercise caution and use additional confirmation tools before making trading decisions based solely on the indicator.
5. Limited Application: The Herrick Payoff Index is primarily designed for analyzing futures contracts and options. It may not be as effective for other financial instruments, such as stocks or forex, limiting its applicability in certain trading scenarios.
6. Lack of Historical Data: The Herrick Payoff Index requires a significant amount of historical data to generate accurate results. In situations where historical data is limited or unavailable, the indicator may not be as reliable or useful.
7. Over-optimization: Traders may be tempted to over-optimize the parameters of the Herrick Payoff Index to fit historical data perfectly. However, this can lead to curve-fitting and result in poor performance in real-time trading.
8. Dependency on Market Volatility: The Herrick Payoff Index is highly dependent on market volatility. In low-volatility periods, the indicator may produce fewer signals, making it less effective for traders who prefer frequent trading opportunities.
Despite these disadvantages, the Herrick Payoff Index can still be a valuable tool in a trader’s arsenal when used in conjunction with other technical indicators and analysis methods. It is important for traders to understand its limitations and use it judiciously to enhance their trading strategies.

Emily Bibb simplifies finance through bestselling books and articles, bridging complex concepts for everyday understanding. Engaging audiences via social media, she shares insights for financial success. Active in seminars and philanthropy, Bibb aims to create a more financially informed society, driven by her passion for empowering others.