
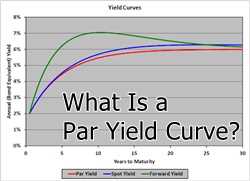
Par Yield Curve Calculation
The par yield curve is calculated by solving a system of equations, where the unknowns are the yields on the fixed-income securities. The equations are derived from the prices or yields of the securities and the present value formula. The goal is to find the yields that make the present value of the cash flows from the securities equal to their prices.
Spot Curve for Treasury Bonds
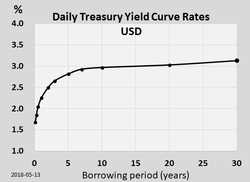
The spot curve for Treasury bonds is a graphical representation of the relationship between the yield and maturity of Treasury bonds. It is a crucial tool for investors and analysts to evaluate the current and future value of these bonds.
The spot curve is derived from the prices of Treasury bonds with different maturities. By analyzing the prices and yields of these bonds, analysts can calculate the spot rates for each maturity. The spot rate represents the yield that an investor would earn by investing in a bond with a specific maturity.
The spot curve is important because it provides insights into the market’s expectations for future interest rates. By examining the shape of the curve, analysts can determine whether the market expects rates to increase or decrease in the future. A steep upward-sloping curve suggests that rates are expected to rise, while a downward-sloping curve indicates that rates are expected to fall.
Investors can use the spot curve to assess the relative value of Treasury bonds with different maturities. By comparing the spot rates for different maturities, investors can identify bonds that offer higher yields relative to their risk. This information can help investors make informed decisions about which bonds to buy or sell.
The spot curve is also used to calculate the present value of future cash flows from Treasury bonds. By discounting future cash flows using the spot rates, analysts can determine the fair value of these bonds. This information is valuable for pricing and trading Treasury bonds in the secondary market.
What is the Spot Curve?
Each point on the spot curve represents the yield of a zero-coupon bond with a specific maturity. The spot rates can be used to calculate the present value of future cash flows from a bond by discounting them at the corresponding spot rate. This allows investors to compare the value of different bonds with different maturities and coupon rates.
How is the Spot Curve Calculated?
The spot curve is calculated using a process called bootstrapping. It involves using the prices of treasury bonds with different maturities to solve for the spot rates. The basic idea is to find the spot rates that make the present value of the bond’s cash flows equal to its market price.
First, the market prices of the treasury bonds are collected. Then, a mathematical model is used to solve for the spot rates that would make the present value of the bond’s cash flows equal to its market price. This process is repeated for each bond in the market, resulting in a set of spot rates for different maturities.
Why is the Spot Curve Important?
The spot curve is important because it provides valuable information about the term structure of interest rates. By analyzing the spot curve, investors can gain insights into market expectations about future interest rates. They can also use the spot curve to calculate the fair value of bonds and assess their relative attractiveness.
Furthermore, the spot curve is used as a benchmark for pricing other fixed income securities, such as corporate bonds and mortgage-backed securities. By comparing the yields of these securities to the spot rates on the spot curve, investors can determine whether they are overpriced or underpriced relative to risk-free treasury bonds.

Emily Bibb simplifies finance through bestselling books and articles, bridging complex concepts for everyday understanding. Engaging audiences via social media, she shares insights for financial success. Active in seminars and philanthropy, Bibb aims to create a more financially informed society, driven by her passion for empowering others.