
What is Opening Range?
Opening Range is a concept used in technical analysis to analyze the price movement of a financial instrument during the initial trading period of a session. It refers to the range between the highest and lowest prices at which a security is traded during the first few minutes or hours of a trading day.
The Opening Range is typically calculated using the high and low prices of the first few minutes or hours of trading, depending on the time frame being analyzed. It provides traders and investors with valuable information about the market’s sentiment and potential price direction for the rest of the trading session.
Definition and Explanation
The Opening Range is a key technical indicator that helps traders identify potential trading opportunities and make informed decisions. It allows them to gauge the market’s volatility, identify support and resistance levels, and determine price breakouts or reversals.
Traders can use various methods to calculate the Opening Range, depending on their trading strategy and time frame. Some common methods include using the first 5-minute candlestick, the first 30-minute candlestick, or the first hour of trading.
Why is Opening Range Important?
By analyzing the Opening Range, traders can also identify potential breakouts or breakdowns from the range, which can signal a significant price movement. This information can be used to develop trading strategies and make more accurate predictions about future price movements.
Benefits and Significance
There are several benefits and significance of using the Opening Range in technical analysis:
- Identifying key support and resistance levels
- Determining potential breakouts or breakdowns
- Assessing market volatility and sentiment
- Developing trading strategies based on price patterns
- Making informed trading decisions
How to Calculate Opening Range?
The calculation of the Opening Range depends on the trader’s preferred time frame and trading strategy. Here is a step-by-step guide on how to calculate the Opening Range:
- Select the desired time frame for analysis (e.g., 5 minutes, 30 minutes, or 1 hour).
- Identify the starting point of the time frame (e.g., the opening of the trading session).
- Record the highest and lowest prices during the selected time frame.
- Calculate the difference between the highest and lowest prices to determine the range.
Traders can use various technical analysis tools, such as charting software or trading platforms, to automatically calculate the Opening Range and display it on their charts.
Opening Range Breakout Strategy
The Opening Range Breakout strategy is a popular trading strategy that aims to capture significant price movements that occur after the market’s opening. It involves entering a trade when the price breaks above or below the Opening Range, indicating a potential trend reversal or continuation.
Traders using the Opening Range Breakout strategy typically set stop-loss orders below the low of the Opening Range for long trades and above the high of the Opening Range for short trades. This helps to manage risk and protect against potential losses.
Additionally, traders can use other technical indicators, such as moving averages or volume analysis, to confirm the validity of the breakout and increase the probability of a successful trade.
Definition and Explanation
The opening range is a concept used in technical analysis to identify the price range within which a security or financial instrument trades during the first few minutes or hours of a trading session. It is often considered a crucial period as it sets the tone for the rest of the trading day.
During the opening range, traders and investors closely monitor the price action and volume to gauge the market sentiment and potential trading opportunities. The opening range is typically defined by the high and low prices reached during this period.
Traders use the opening range to identify key support and resistance levels, as well as breakout and breakdown points. It helps them determine the overall market direction and make informed trading decisions.
The opening range can vary in duration, depending on the market and the trader’s preference. Some traders focus on the first few minutes of the trading session, while others consider the first hour or two. The choice of the opening range duration depends on the trader’s strategy and the specific market conditions.
It is important to note that the opening range is not a standalone indicator or strategy. It is used in conjunction with other technical analysis tools and indicators to confirm or validate trading signals.
Traders can use various methods to calculate the opening range, including manually tracking the price movements or using specialized software or trading platforms that provide this information in real-time.
Why is Opening Range Important?
The opening range is an important concept in technical analysis as it provides valuable information about the market sentiment and potential price movements for the trading day. It helps traders and investors to gauge the market’s initial reaction to news, economic data, or other events that may impact the price of a security.
By analyzing the opening range, traders can identify key support and resistance levels, as well as potential breakout or breakdown points. This information can be used to develop trading strategies and make more informed decisions about buying or selling securities.
Market Sentiment
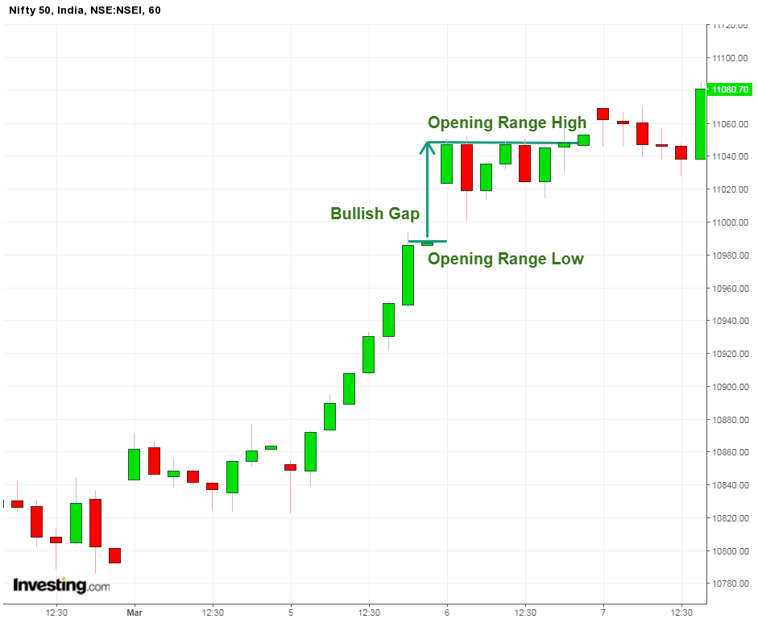
The opening range can provide insights into market sentiment, which refers to the overall attitude or feeling of market participants towards a particular security or the market as a whole. By analyzing the opening range, traders can determine whether the market sentiment is bullish, bearish, or neutral.
If the price opens above the previous day’s high, it suggests a bullish sentiment, indicating that buyers are in control and there is potential for further price appreciation. On the other hand, if the price opens below the previous day’s low, it suggests a bearish sentiment, indicating that sellers are in control and there is potential for further price depreciation.
Support and Resistance Levels
The opening range can also help identify key support and resistance levels, which are levels at which the price tends to find support or encounter resistance. These levels can act as barriers that prevent the price from moving higher or lower.
If the price breaks above the upper boundary of the opening range, it suggests a potential breakout and indicates that the price may continue to rise. Conversely, if the price breaks below the lower boundary of the opening range, it suggests a potential breakdown and indicates that the price may continue to decline.
Identifying these support and resistance levels can be useful for setting profit targets and stop-loss orders, as well as for determining entry and exit points for trades.
Trading Strategies
By using the opening range as a reference point, traders can establish clear entry and exit criteria, which can help improve the accuracy and profitability of their trades.
Benefits and Significance of Opening Range
1. Market Direction
One of the key benefits of analyzing the opening range is its ability to provide information about the market direction for the day. By observing the price action during the opening period, traders can gain insights into whether the market is likely to trend upwards, downwards, or remain range-bound. This information can be used to adjust trading strategies and position oneself accordingly.
2. Volatility Assessment
The opening range can also help traders assess the level of volatility in the market. By analyzing the range between the high and low prices during the opening period, traders can gauge the level of price fluctuations and adjust their risk management strategies accordingly. High volatility may present opportunities for larger profits but also carries higher risks, while low volatility may indicate a lack of trading opportunities.
3. Breakout Opportunities
One of the most significant applications of the opening range is in identifying breakout opportunities. A breakout occurs when the price moves outside the high or low of the opening range, indicating a potential shift in market sentiment. Traders can use breakout strategies to enter trades in the direction of the breakout, potentially capturing significant profits. The opening range provides a clear reference point for identifying these breakout levels.
4. Support and Resistance Levels
The high and low of the opening range can also serve as important support and resistance levels. These levels can act as barriers for price movement and provide traders with valuable information about potential entry and exit points. By monitoring how the price interacts with the opening range levels, traders can make more informed decisions about when to enter or exit trades.
5. Confirmation of Trends
The opening range can also be used to confirm or validate existing trends. If the price remains within the opening range, it may indicate that the current trend is likely to continue. On the other hand, if the price breaks out of the opening range in the opposite direction of the trend, it may suggest a potential reversal. Traders can use this information to adjust their trading strategies and manage risk accordingly.
How to Calculate Opening Range?
Calculating the opening range is an essential step in technical analysis as it provides valuable information about the price movement at the beginning of a trading session. The opening range is typically calculated using the high and low prices during a specific time period, usually the first few minutes or hours of the trading session.
Step 1: Determine the Time Period
The first step in calculating the opening range is to determine the time period you want to analyze. This can vary depending on your trading strategy and the market you are trading. For example, you may choose to calculate the opening range based on the first 15 minutes of the trading session.
Step 2: Identify the High and Low Prices
Once you have determined the time period, you need to identify the high and low prices during that period. This can be done by looking at the price chart or using a technical analysis tool that provides this information. The high price represents the highest price reached during the time period, while the low price represents the lowest price reached.
Step 3: Calculate the Range
After identifying the high and low prices, you can calculate the range by subtracting the low price from the high price. The range represents the difference between the highest and lowest prices during the opening period.
Step 4: Interpret the Opening Range
Once you have calculated the opening range, you can use it to gain insights into the market dynamics. A wider opening range indicates higher volatility and potential for larger price movements, while a narrower opening range suggests lower volatility and a more stable market. Traders often use the opening range as a reference point for setting stop-loss and take-profit levels, as well as identifying potential breakout or reversal opportunities.
Step-by-Step Guide to Calculate Opening Range
The opening range is an important concept in technical analysis that helps traders identify potential trading opportunities. Calculating the opening range involves a few simple steps:
Step 1: Determine the Time Frame
First, you need to decide on the time frame for which you want to calculate the opening range. This could be the opening minutes, hours, or even the first trading day of a particular market.
Step 2: Identify the Opening Price
Next, you need to identify the opening price for the chosen time frame. This is usually the first price at which a security or market starts trading during the specified time frame.
Step 3: Determine the High and Low Prices
Once you have the opening price, you need to track the highest and lowest prices reached during the chosen time frame. This can be done by monitoring the price movements and recording the highest and lowest values.
Step 4: Calculate the Range
After determining the high and low prices, you can calculate the opening range by subtracting the low price from the high price. This will give you the range within which the security or market has traded during the specified time frame.
Step 5: Analyze the Opening Range
Once you have calculated the opening range, you can analyze it to identify potential trading opportunities. Traders often look for breakouts or breakdowns of the opening range as signals for entering or exiting trades.
By following these steps, you can calculate the opening range for any given time frame and use it as a tool for making informed trading decisions.
Opening Range Breakout Strategy
The Opening Range Breakout Strategy is a popular trading strategy used by traders to take advantage of the price volatility that occurs during the opening range of a trading session. This strategy involves identifying the high and low prices of the opening range and placing trades when the price breaks out of this range.
To implement the Opening Range Breakout Strategy, traders first need to identify the opening range, which is the range between the high and low prices during the initial period of a trading session. This period is typically the first 30 minutes to an hour of the trading day. Traders can use various technical indicators, such as moving averages or support and resistance levels, to determine the opening range.
Once the opening range is identified, traders can place trades when the price breaks above the high of the opening range or below the low of the opening range. This breakout is considered a signal that the price is likely to continue in the direction of the breakout. Traders can enter long positions when the price breaks above the high of the opening range and enter short positions when the price breaks below the low of the opening range.
The Opening Range Breakout Strategy can be applied to various markets, such as stocks, futures, and forex. It is particularly popular among day traders who aim to capitalize on the price volatility during the opening range. This strategy can be used on different timeframes, depending on the trader’s trading style and preferences.
Overall, the Opening Range Breakout Strategy is a simple yet effective trading strategy that allows traders to take advantage of the price movements during the opening range of a trading session. By identifying the high and low prices of the opening range and placing trades when the price breaks out of this range, traders can potentially profit from the price volatility and momentum in the market.

Emily Bibb simplifies finance through bestselling books and articles, bridging complex concepts for everyday understanding. Engaging audiences via social media, she shares insights for financial success. Active in seminars and philanthropy, Bibb aims to create a more financially informed society, driven by her passion for empowering others.