
Benefits of the Least Squares Method in Financial Analysis
The least squares method is a powerful tool used in financial analysis to determine the relationship between two or more variables. It is particularly useful in analyzing financial data because it allows for the identification of trends, patterns, and correlations that can help make informed investment decisions.
There are several benefits of using the least squares method in financial analysis:
- Accurate Estimation: The least squares method provides a reliable and accurate estimation of the relationship between variables. It minimizes the sum of the squared differences between the observed and predicted values, resulting in the best-fit line or curve that represents the data.
- Forecasting: The least squares method can be used to forecast future values based on historical data. By fitting a line or curve to the data, analysts can make predictions about future trends and patterns, helping them make informed investment decisions.
- Risk Management: The least squares method can also be used for risk management purposes. By analyzing the relationship between variables, analysts can identify potential risks and develop strategies to mitigate them. For example, if there is a strong negative correlation between two stocks, an investor can diversify their portfolio to reduce the risk of losses.
- Model Validation: The least squares method allows analysts to validate their financial models. By comparing the predicted values with the observed values, they can assess the accuracy and reliability of their models. This is crucial for making sound financial decisions and avoiding potential pitfalls.
Examples of the Least Squares Method in Financial Analysis
The least squares method is a powerful tool in financial analysis that allows analysts to estimate the relationship between two or more variables. By finding the line of best fit that minimizes the sum of the squared differences between the observed and predicted values, the least squares method provides valuable insights into the relationship between variables and helps in making informed financial decisions.
Here are a few examples of how the least squares method can be applied in financial analysis:
1. Stock Price Analysis: The least squares method can be used to analyze the relationship between a company’s stock price and various factors such as earnings, sales, or market conditions. By fitting a linear regression model using historical data, analysts can estimate the impact of these factors on the stock price and make predictions for future price movements.
2. Portfolio Optimization: In portfolio management, the least squares method can be used to estimate the optimal weights for different assets in a portfolio. By considering historical returns and risk measures for each asset, analysts can use the least squares method to find the portfolio allocation that minimizes risk or maximizes returns, based on their investment objectives.
3. Credit Risk Assessment: The least squares method can also be applied in credit risk assessment to estimate the probability of default for borrowers. By considering various financial and non-financial variables, such as income, credit score, and employment history, analysts can use the least squares method to build a predictive model that helps in assessing the creditworthiness of borrowers.
4. Financial Forecasting: The least squares method is widely used in financial forecasting to estimate future values of a variable based on historical data. By fitting a regression model using past observations, analysts can make predictions for future values, which can be useful in budgeting, financial planning, and decision-making.
5. Asset Valuation: The least squares method can be used to estimate the value of assets such as real estate, bonds, or derivatives. By considering relevant variables such as market conditions, interest rates, or comparable sales, analysts can use the least squares method to determine the fair value of assets and make informed investment decisions.
Explanation of the Least Squares Method and its Applications
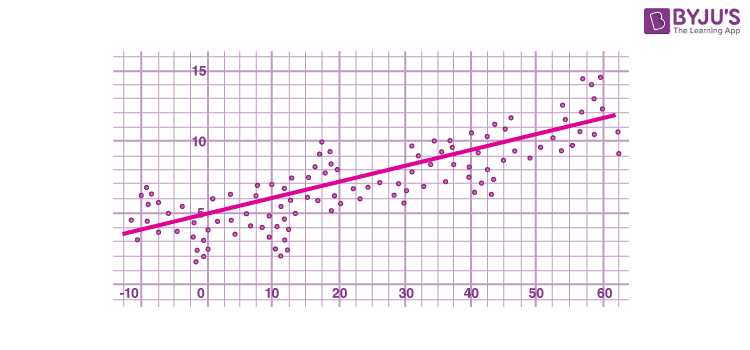
The least squares method is a statistical technique used to find the best-fitting line or curve for a set of data points. It is widely used in financial analysis to analyze and predict trends, as well as to estimate the relationship between variables.
Once you have the data points, you can use the least squares method to find the equation of the line or curve that best fits the data. This equation can then be used to make predictions or analyze the relationship between the variables.
One of the main benefits of the least squares method is that it provides a quantitative measure of the relationship between variables. It allows you to determine the strength and direction of the relationship, as well as to make predictions based on the data.
The least squares method is widely used in financial analysis for various purposes. For example, it can be used to estimate the beta coefficient, which measures the sensitivity of a stock’s returns to changes in the overall market. It can also be used to analyze the relationship between interest rates and bond prices, or to forecast future sales based on historical data.

Emily Bibb simplifies finance through bestselling books and articles, bridging complex concepts for everyday understanding. Engaging audiences via social media, she shares insights for financial success. Active in seminars and philanthropy, Bibb aims to create a more financially informed society, driven by her passion for empowering others.