
What is a Hammer Candlestick?
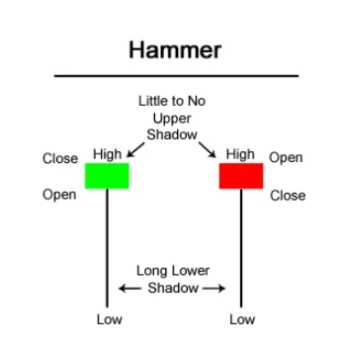
A hammer candlestick is a powerful tool used in technical analysis to identify potential reversals in a stock’s price trend. It is characterized by a small body, a long lower shadow, and little to no upper shadow. The shape of the candlestick resembles a hammer, hence the name.
Hammer candlestick patterns are formed when the opening and closing prices are near the same level, but there is a significant price decline during the trading session. This indicates that sellers pushed the price lower, but buyers were able to regain control and push the price back up, resulting in a long lower shadow.
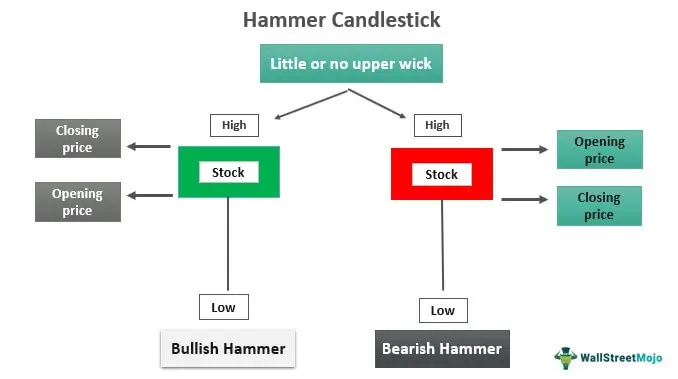
The small body of the hammer candlestick represents the difference between the opening and closing prices. If the body is filled or colored, it suggests a bearish sentiment, indicating that sellers are still in control. If the body is hollow or white, it suggests a bullish sentiment, indicating that buyers are gaining strength.
Identifying Hammer Candlestick Patterns in Technical Analysis
To identify a hammer candlestick pattern, traders look for the following characteristics:
- A small body, indicating a narrow range between the opening and closing prices
- A long lower shadow, at least twice the length of the body
- Little to no upper shadow
These characteristics differentiate a hammer candlestick from other candlestick patterns and help traders identify potential reversals in the price trend.
Utilizing Hammer Candlestick Patterns for Investment Decisions
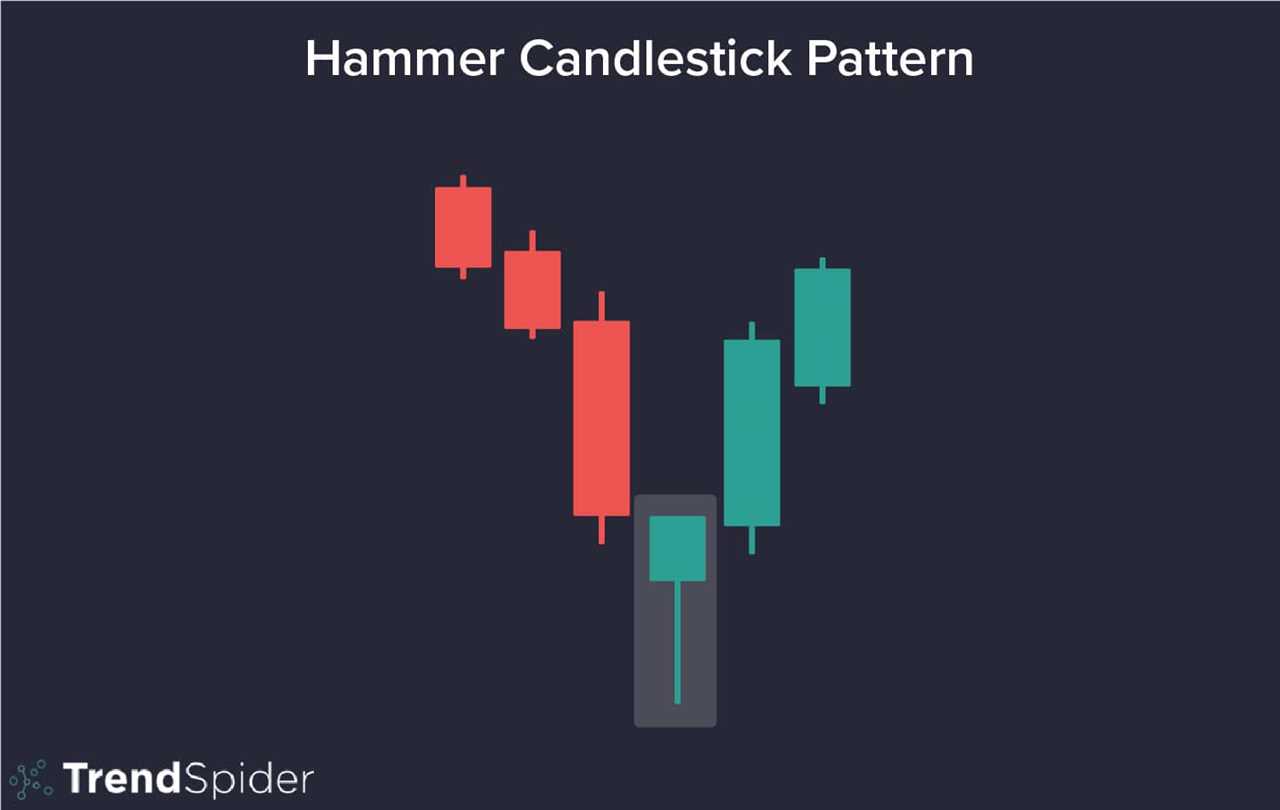
Traders and investors can use hammer candlestick patterns to make informed investment decisions. When a hammer candlestick pattern forms after a downtrend, it suggests that the selling pressure is weakening and buyers are stepping in. This could be a signal to buy the stock or enter a long position.
However, it is important to consider other factors such as volume, trendlines, and support and resistance levels to confirm the validity of the hammer candlestick pattern. It is also advisable to use other technical indicators and analysis techniques to enhance the accuracy of the investment decision.
Key Factors to Consider when Using Hammer Candlestick Patterns
When using hammer candlestick patterns, it is important to keep the following factors in mind:
- Confirmation: Look for confirmation from other technical indicators or analysis techniques to increase the reliability of the hammer candlestick pattern.
- Volume: Higher volume during the formation of a hammer candlestick pattern suggests stronger buying or selling pressure.
- Trendlines: Consider the overall trend of the stock and how the hammer candlestick pattern aligns with the trend.
By considering these factors, traders can make more informed investment decisions when utilizing hammer candlestick patterns.
What is a Hammer Candlestick?
A hammer candlestick is a single candlestick pattern that is formed when the price opens near its high, experiences a significant decline during the trading session, and then rallies to close near its opening price. The candlestick resembles a hammer, with a small body and a long lower shadow.
The hammer candlestick pattern is considered a bullish reversal pattern, indicating that a potential trend reversal may occur. It suggests that buyers have stepped in after a period of selling pressure, signaling a shift in market sentiment.
Key Characteristics of Hammer Candlestick Patterns
There are several key characteristics to look for when identifying hammer candlestick patterns:
| Characteristics | Description |
|---|---|
| Small Body | The body of the candlestick should be relatively small compared to the length of the lower shadow. |
| Long Lower Shadow | The lower shadow should be at least twice the length of the body, indicating a strong rejection of lower prices. |
| No Upper Shadow | The candlestick should have little to no upper shadow, indicating minimal selling pressure. |
| Opening Price Near High | The opening price should be near the high of the candlestick, showing initial buying pressure. |
| Closing Price Near Opening Price | The closing price should be near the opening price, indicating a potential reversal in market sentiment. |
Interpreting Hammer Candlestick Patterns
When a hammer candlestick pattern is identified, it suggests that buyers have regained control and are likely to push the price higher. However, it is important to consider other factors and confirm the pattern with additional technical analysis tools before making investment decisions.
Some factors to consider when interpreting hammer candlestick patterns include:
- Volume: High volume during the formation of a hammer candlestick pattern can indicate stronger buying pressure and increase the reliability of the pattern.
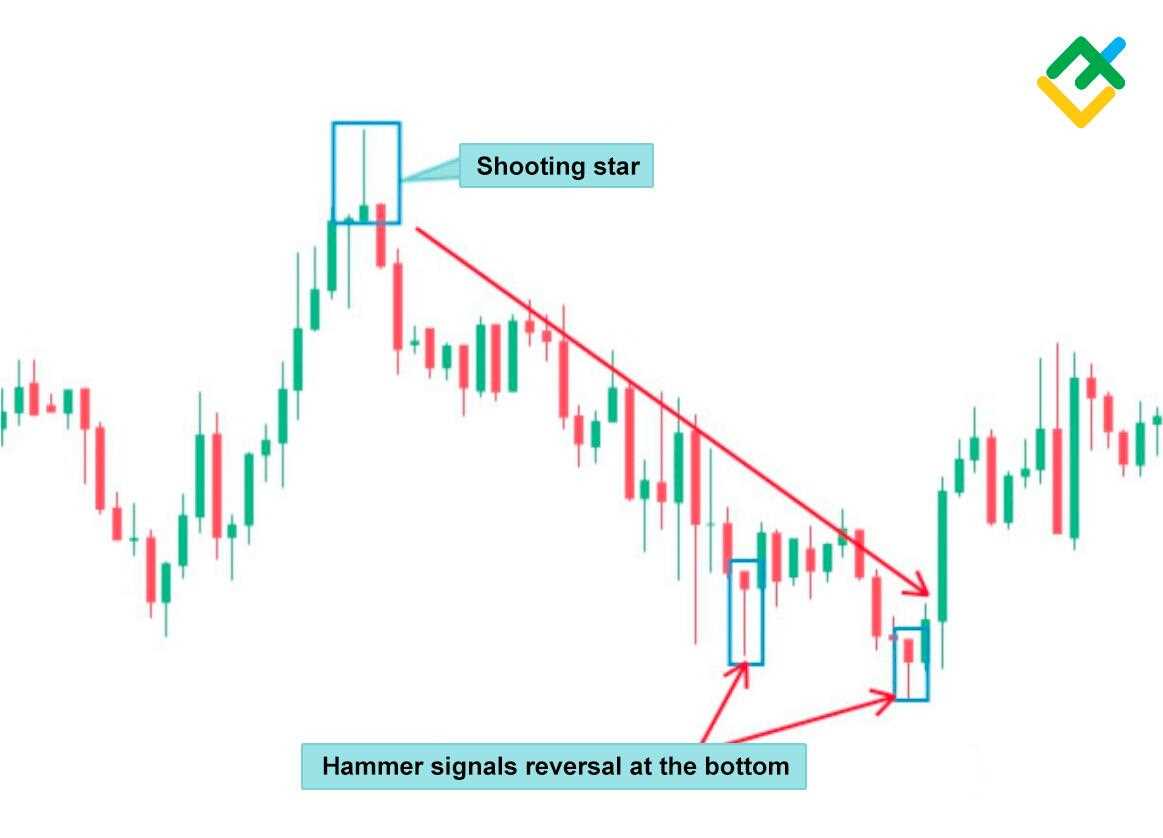
- Trend: Hammer candlestick patterns are more significant when they occur within a downtrend, indicating a potential trend reversal.
- Confirmation: It is important to confirm the hammer candlestick pattern with other technical indicators, such as trendlines, moving averages, or support and resistance levels.
Identifying Hammer Candlestick Patterns in Technical Analysis
In technical analysis, the hammer candlestick pattern is a powerful tool that can help investors identify potential trend reversals and make informed investment decisions. This pattern is formed when the price of an asset opens significantly lower than its previous close, but then rallies to close near or above its opening price.
To identify a hammer candlestick pattern, investors should look for the following characteristics:
1. Long lower shadow: The hammer candlestick has a long lower shadow, which represents the low price reached during the trading session. This indicates that sellers pushed the price down, but buyers were able to regain control and push the price back up.
2. Small real body: The real body of the hammer candlestick is small or non-existent, indicating that there was little or no price movement between the opening and closing prices. This suggests indecision in the market.
3. Upper shadow: The hammer candlestick may also have a small upper shadow, but it is not necessary for the pattern to be valid.
Once a hammer candlestick pattern is identified, investors can use it as a signal to enter or exit a trade. If the pattern occurs after a downtrend, it may indicate that the selling pressure is weakening and a reversal may be imminent. Conversely, if the pattern occurs after an uptrend, it may suggest that the buying pressure is waning and a potential reversal may occur.
It is important to note that the hammer candlestick pattern should be confirmed by other technical indicators or chart patterns before making any investment decisions. This can help reduce the risk of false signals and increase the probability of successful trades.
Utilizing Hammer Candlestick Patterns for Investment Decisions
When utilizing hammer candlestick patterns, it is important to consider the following factors:
1. Confirmation:
Before making any investment decisions based on hammer candlestick patterns, it is crucial to confirm the pattern with other technical indicators or chart patterns. This helps to ensure that the signal provided by the hammer candlestick is reliable and not a false signal.
2. Trend Analysis:
It is essential to analyze the overall trend of the market before considering a hammer candlestick pattern. If the market is in a strong downtrend, a hammer candlestick pattern may not be as reliable as it could indicate a temporary pause or correction rather than a trend reversal.
3. Volume:
Volume is an important factor to consider when utilizing hammer candlestick patterns. Higher volume during the formation of a hammer candlestick pattern can indicate stronger buying or selling pressure, increasing the reliability of the pattern.
4. Timeframe:
The timeframe used for analyzing hammer candlestick patterns can have a significant impact on the reliability of the signals. It is important to consider the timeframe that aligns with your investment strategy and goals.
5. Risk Management:
As with any investment strategy, risk management is crucial when utilizing hammer candlestick patterns. It is important to set stop-loss orders and take-profit levels to protect against potential losses and secure profits.
By considering these factors and incorporating hammer candlestick patterns into your technical analysis, you can enhance your investment decision-making process and potentially improve your overall trading performance.
Key Factors to Consider when Using Hammer Candlestick Patterns
When utilizing hammer candlestick patterns for investment decisions, there are several key factors that investors should consider. These factors can help provide valuable insights and increase the effectiveness of using hammer candlestick patterns in technical analysis.
1. Confirmation:
2. Volume:
Volume plays a crucial role in analyzing hammer candlestick patterns. High volume during the formation of a hammer candlestick can indicate strong buying or selling pressure, adding credibility to the pattern. On the other hand, low volume may suggest weak market participation and less reliable signals. Therefore, it is important to consider the volume accompanying the hammer candlestick to validate its significance.
3. Trend:
4. Support and Resistance Levels:
Identifying key support and resistance levels can enhance the effectiveness of hammer candlestick patterns. If a hammer candlestick forms near a significant support level, it can provide a stronger signal for a potential reversal. Conversely, if a hammer candlestick forms near a strong resistance level, it may indicate a potential continuation of the existing trend. Considering the proximity of the hammer candlestick to these levels can help determine the strength of the signal.
5. Timeframe:
The timeframe used for analyzing hammer candlestick patterns is crucial. Different timeframes can provide varying levels of reliability and significance. Shorter timeframes may generate more frequent but less reliable signals, while longer timeframes may produce fewer but more reliable signals. It is important to choose a timeframe that aligns with the investor’s trading style and objectives.
6. Risk Management:
Implementing proper risk management strategies is essential when using hammer candlestick patterns. Setting stop-loss orders and determining target levels can help protect against potential losses and maximize profits. It is important to establish a risk-reward ratio that aligns with the investor’s risk tolerance and trading strategy.

Emily Bibb simplifies finance through bestselling books and articles, bridging complex concepts for everyday understanding. Engaging audiences via social media, she shares insights for financial success. Active in seminars and philanthropy, Bibb aims to create a more financially informed society, driven by her passion for empowering others.