What is Trailing 12 Months (TTM) and How It’s Calculated

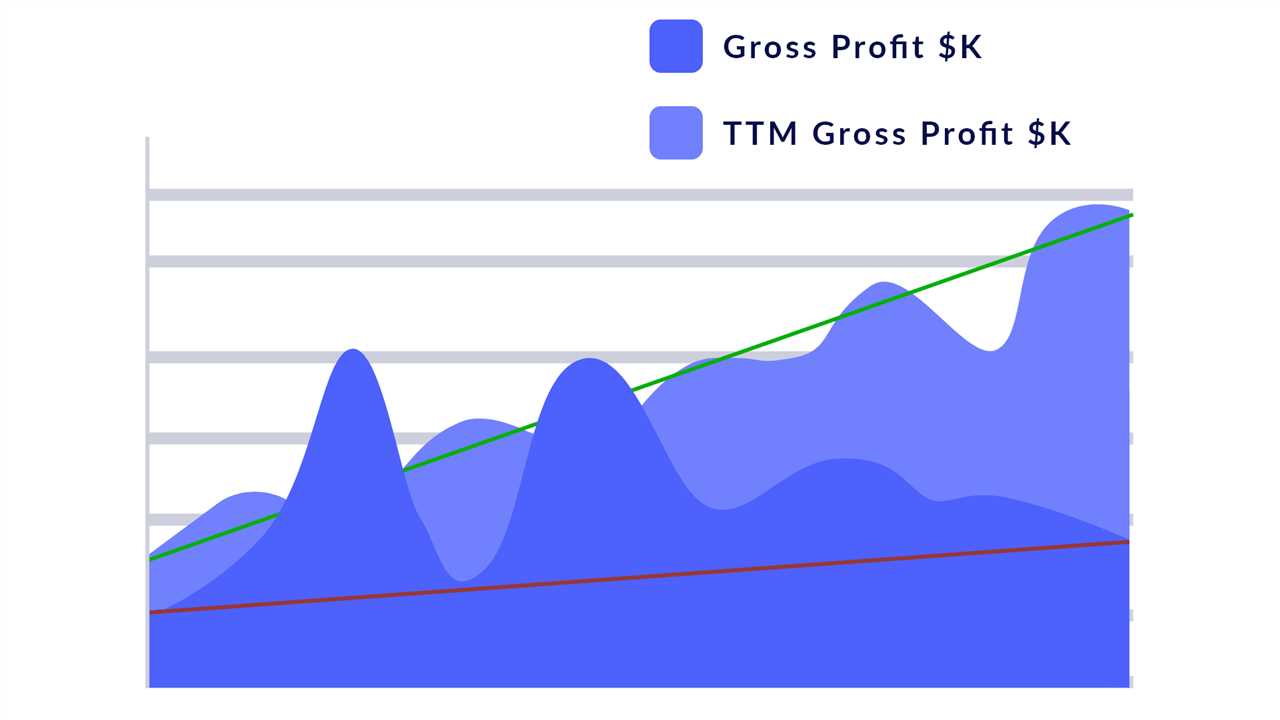
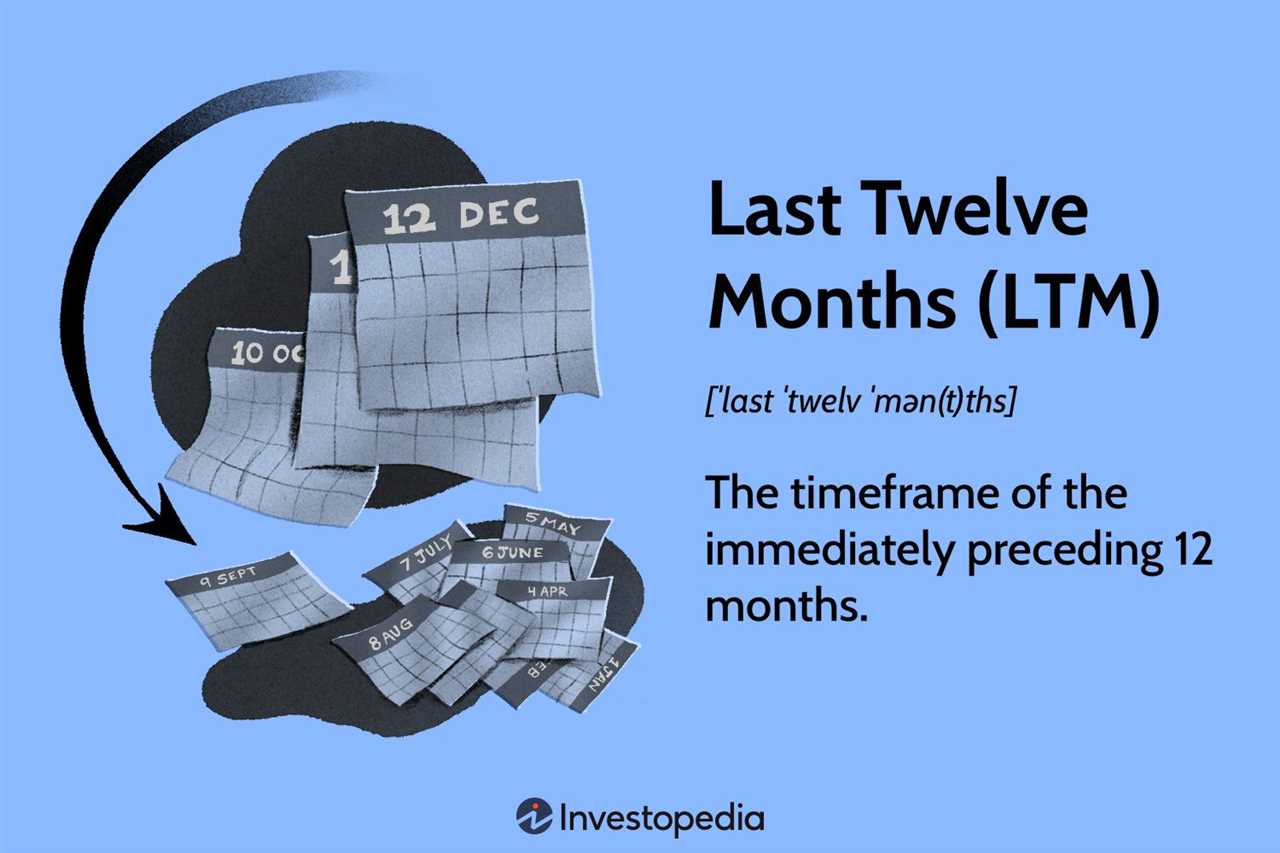
Trailing 12 Months (TTM) is a financial metric used to analyze a company’s performance over the past 12 months. It provides a more accurate and up-to-date picture of a company’s financial health compared to annual or quarterly reports.
Calculation of Trailing 12 Months (TTM)
To calculate the TTM, you need to sum up the data for the past 12 months. This can include various financial metrics such as revenue, earnings, cash flow, or any other relevant metric. For example, if you want to calculate the TTM revenue, you would add up the revenue for the past 12 months.
Usage of Trailing 12 Months (TTM) in Financial Ratios
Some of the financial ratios that utilize TTM data include the price-to-earnings ratio (P/E ratio), the price-to-sales ratio (P/S ratio), and the price-to-cash flow ratio (P/CF ratio). These ratios compare the current market value of a company’s stock to its TTM earnings, revenue, or cash flow, respectively.
By using TTM data, investors can make more informed decisions about the value and profitability of a company. It provides a more accurate representation of a company’s financial performance and helps to identify trends and patterns over time.
The Trailing 12 Months (TTM) is a financial metric used to analyze a company’s performance over the most recent 12-month period. It provides a snapshot of the company’s financial health and helps investors and analysts assess its current and future prospects.
The TTM calculation involves summing up the financial data from the past four quarters, which allows for a more accurate representation of the company’s performance compared to just looking at a single quarter. By considering the data from the previous 12 months, the TTM metric smooths out any seasonal or short-term fluctuations that may occur.
One of the key benefits of using the TTM metric is that it provides a more comprehensive view of a company’s financial performance compared to other time periods. It takes into account any changes or trends that may have occurred over the past year, allowing investors to make more informed decisions.
The TTM metric is commonly used in financial ratios and analysis. It is particularly useful in evaluating a company’s profitability, as it provides a more accurate measure of its earnings over a longer period. By using the TTM metric, investors can better understand the company’s ability to generate consistent profits and assess its overall financial stability.
Additionally, the TTM metric can be used to compare a company’s performance with its competitors or industry benchmarks. By analyzing the TTM data of multiple companies, investors can identify trends and patterns within the industry and make more informed investment decisions.
Calculation of Trailing 12 Months (TTM)

The trailing 12 months (TTM) is a financial metric used to analyze a company’s performance over the past 12 months. It provides a snapshot of the company’s financial health and allows investors and analysts to assess its current and historical performance.
To calculate the TTM, you need to gather the financial data for the past four quarters. This includes the income statement, balance sheet, and cash flow statement. The TTM calculation takes into account the most recent quarter and the three previous quarters.
Here is an example of how to calculate the TTM for a company’s revenue:
Step 1: Gather the quarterly revenue data
Collect the revenue figures for the past four quarters. For example:
| Quarter | Revenue |
|---|---|
| Q1 | $10 million |
| Q2 | $12 million |
| Q3 | $15 million |
| Q4 | $13 million |
Step 2: Add up the quarterly revenue
Add up the revenue figures for the past four quarters:
$10 million + $12 million + $15 million + $13 million = $50 million
Step 3: Divide the total by 4

Divide the total revenue by 4 to get the average quarterly revenue:
$50 million / 4 = $12.5 million
Step 4: Multiply the average quarterly revenue by 12
Multiply the average quarterly revenue by 12 to get the TTM revenue:
$12.5 million * 12 = $150 million
Therefore, the TTM revenue for the company is $150 million.
The same calculation can be applied to other financial metrics such as net income, earnings per share, or operating cash flow to determine their TTM values.
Usage of Trailing 12 Months (TTM) in Financial Ratios
Trailing 12 Months (TTM) is a commonly used financial metric that provides a snapshot of a company’s performance over the past 12 months. It is particularly useful in calculating various financial ratios, which are essential for evaluating a company’s financial health and making informed investment decisions.
One of the key financial ratios that utilizes the TTM data is the Price-to-Earnings (P/E) ratio. The P/E ratio is calculated by dividing the current market price of a company’s stock by its earnings per share (EPS) over the TTM period. This ratio helps investors assess the relative value of a company’s stock and compare it to its peers in the industry.
Another important ratio that incorporates TTM data is the Price-to-Sales (P/S) ratio. The P/S ratio is calculated by dividing the market price per share by the company’s revenue per share over the TTM period. This ratio is useful in evaluating a company’s sales performance and determining its market value relative to its revenue.
The TTM data is also used in calculating the Return on Equity (ROE) ratio, which measures a company’s profitability by comparing its net income to its shareholders’ equity over the TTM period. The ROE ratio is a key indicator of a company’s ability to generate profits from its shareholders’ investments.
Additionally, the TTM data is utilized in computing the Debt-to-Equity (D/E) ratio, which assesses a company’s financial leverage by comparing its total debt to its shareholders’ equity over the TTM period. This ratio helps investors evaluate a company’s risk profile and its ability to meet its financial obligations.
Furthermore, the TTM data is crucial in calculating the Earnings per Share (EPS) ratio, which measures a company’s profitability on a per-share basis over the TTM period. The EPS ratio is widely used by investors to determine a company’s earnings potential and its ability to generate returns for shareholders.

Emily Bibb simplifies finance through bestselling books and articles, bridging complex concepts for everyday understanding. Engaging audiences via social media, she shares insights for financial success. Active in seminars and philanthropy, Bibb aims to create a more financially informed society, driven by her passion for empowering others.
