
What is Relative Vigor Index (RVI)?
The Relative Vigor Index (RVI) is a technical analysis indicator that measures the strength of a trend by comparing the closing price to the trading range of a financial instrument. It was developed by John Ehlers and introduced in his book “Cybernetic Analysis for Stocks and Futures.”
Definition and Explanation
The RVI is based on the concept that in a bullish trend, the closing price tends to be higher than the opening price, and in a bearish trend, the closing price tends to be lower than the opening price. The RVI calculates the difference between the closing price and the midpoint of the trading range and then compares it to the difference between the opening price and the midpoint of the trading range.
The RVI is plotted as a line on a chart, with values ranging from -1 to +1. A positive RVI value indicates a bullish trend, while a negative value indicates a bearish trend. The RVI can also be used to identify potential trend reversals when it crosses above or below a certain threshold level.
Formula for Calculating Relative Vigor Index (RVI)
The formula for calculating the RVI is as follows:
- Calculate the typical price, which is the average of the high, low, and closing prices.
- Calculate the difference between the closing price and the midpoint of the trading range.
- Calculate the difference between the opening price and the midpoint of the trading range.
- Calculate the sum of the positive differences and the sum of the negative differences.
- Calculate the RVI by dividing the sum of the positive differences by the sum of the negative differences.
Uses of Relative Vigor Index (RVI) in Trading
The RVI is primarily used to confirm trends and identify potential trend reversals. Traders can use the RVI to determine whether a trend is strong or weak by looking at the value of the indicator. A high positive value indicates a strong bullish trend, while a low negative value indicates a strong bearish trend.
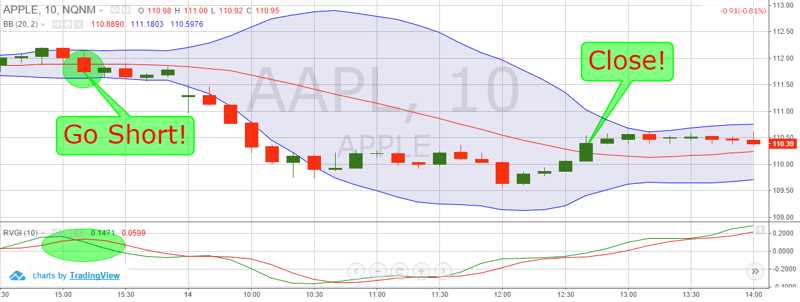
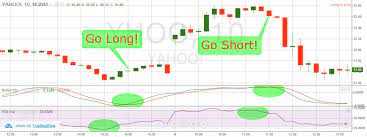
Traders can also use the RVI to generate trading signals. For example, when the RVI crosses above a certain threshold level, it can be interpreted as a buy signal, indicating that the bullish trend is gaining strength. Conversely, when the RVI crosses below a certain threshold level, it can be interpreted as a sell signal, indicating that the bearish trend is gaining strength.
Overall, the RVI is a useful tool for technical traders to analyze the strength of trends and identify potential trading opportunities. However, like any technical indicator, it should be used in conjunction with other analysis techniques to make informed trading decisions.
Definition and Explanation
The Relative Vigor Index (RVI) is a technical analysis indicator that measures the conviction or strength of a trend in the financial markets. It was developed by John Ehlers and introduced in his book “Cybernetic Analysis for Stocks and Futures” in 2004.
The RVI is based on the concept that the strength of a price movement can be determined by comparing the closing price to the opening price within a given period. It calculates the difference between the closing price and the opening price and then compares it to the difference between the high and low prices of that period.
The RVI is typically used to identify potential trend reversals or confirm the strength of an existing trend. It is considered a leading indicator, as it provides signals before the actual price movement occurs.
When the RVI is above a certain threshold, it indicates that the bulls have the upper hand and the trend is likely to continue. Conversely, when the RVI is below the threshold, it suggests that the bears are in control and a trend reversal may occur.
Traders often use the RVI in conjunction with other technical indicators or chart patterns to confirm their trading decisions. It can be applied to various timeframes, from intraday trading to long-term investing.
It is important to note that the RVI is not a standalone indicator and should be used in combination with other analysis techniques to increase the accuracy of trading signals.
Formula for Calculating Relative Vigor Index (RVI)
The Relative Vigor Index (RVI) is a technical analysis indicator that measures the conviction of a price trend. It is calculated using the following formula:
| Step | Calculation |
|---|---|
| 1 | Calculate the difference between the closing price and the opening price of each period. |
| 2 | Calculate the difference between the highest price and the lowest price of each period. |
| 3 | Calculate the average of the closing price differences and the opening price differences. |
| 4 | Calculate the average of the high-low price differences. |
| 5 | Divide the average closing and opening price differences by the average high-low price differences. |
| 6 | Multiply the result by 100 to get the RVI value. |
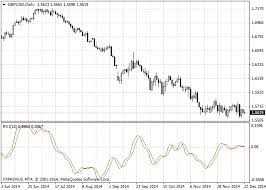
The RVI is typically displayed as a line chart that oscillates around a centerline. Values above the centerline indicate bullishness, while values below the centerline indicate bearishness.
Traders use the RVI to identify potential trend reversals, confirm the strength of a trend, and generate buy or sell signals. It can be used in conjunction with other technical indicators to improve trading decisions.
Uses of Relative Vigor Index (RVI) in Trading
The Relative Vigor Index (RVI) is a technical indicator that is commonly used by traders to identify the strength of a trend and to generate trading signals. It is based on the concept that the closing price tends to be higher during uptrends and lower during downtrends.
Here are some of the main uses of the Relative Vigor Index (RVI) in trading:
1. Trend Confirmation:
The RVI can be used to confirm the strength of a trend. When the RVI is above a certain threshold, it indicates that the trend is strong and likely to continue. Conversely, when the RVI is below the threshold, it suggests that the trend is weak and may reverse.
2. Overbought and Oversold Conditions:
The RVI can also be used to identify overbought and oversold conditions in the market. When the RVI reaches extreme levels, it suggests that the price may be due for a reversal. Traders can use this information to enter or exit positions accordingly.
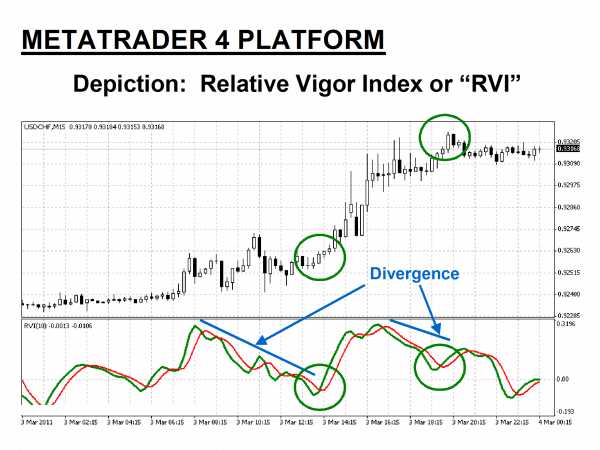
3. Divergence:
Divergence occurs when the price and the RVI move in opposite directions. This can be a sign of a potential trend reversal. Traders can look for divergences between the RVI and the price to identify possible trading opportunities.
4. Trading Signals:
The RVI can generate trading signals when it crosses certain thresholds or when it diverges from the price. For example, a bullish signal is generated when the RVI crosses above a certain level, indicating a potential uptrend. Conversely, a bearish signal is generated when the RVI crosses below a certain level, suggesting a potential downtrend.
5. Risk Management:
The RVI can also be used as a tool for risk management. Traders can use the RVI to set stop-loss orders or to determine the size of their positions. For example, if the RVI indicates a strong uptrend, traders may choose to set tighter stop-loss orders to protect their profits.

Emily Bibb simplifies finance through bestselling books and articles, bridging complex concepts for everyday understanding. Engaging audiences via social media, she shares insights for financial success. Active in seminars and philanthropy, Bibb aims to create a more financially informed society, driven by her passion for empowering others.