
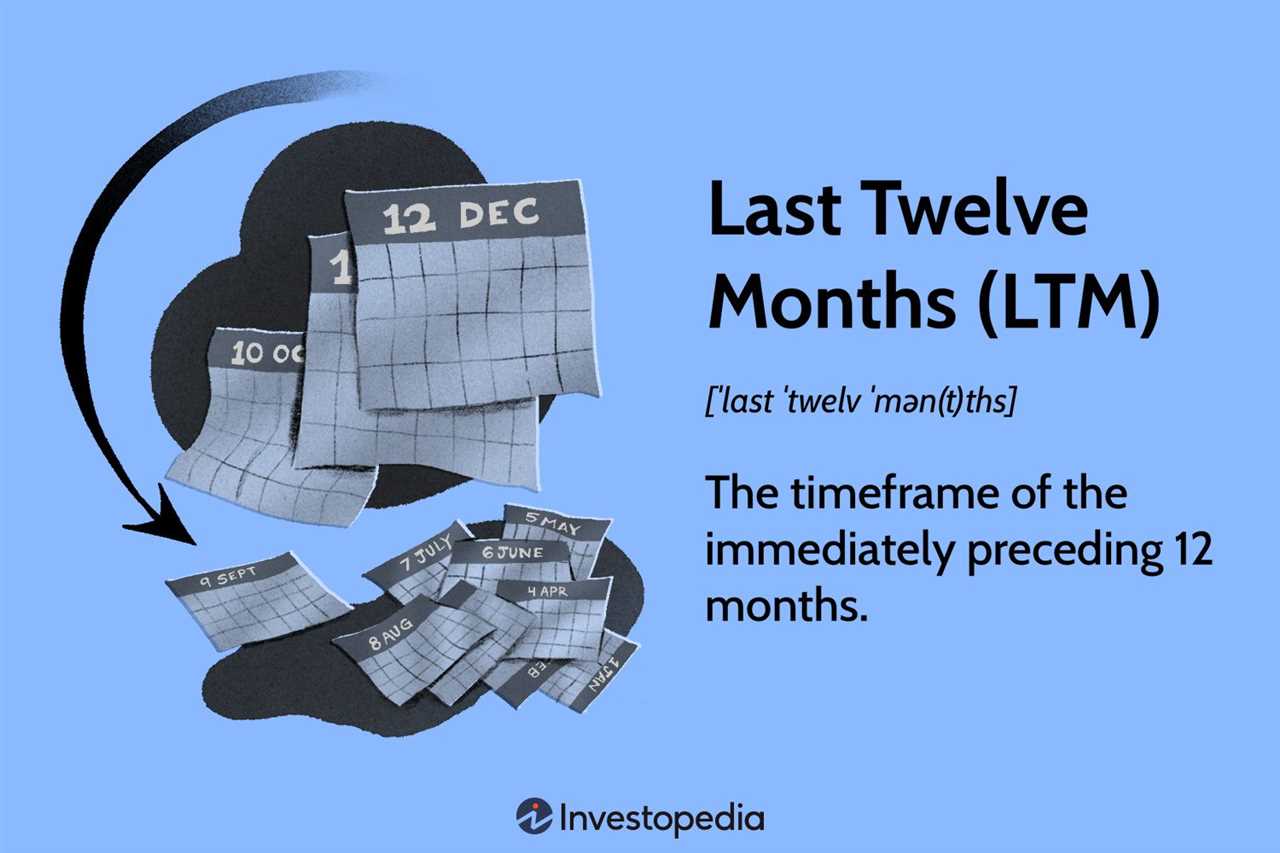
Last Twelve Months (LTM) Definition

The Last Twelve Months (LTM) is a financial metric used in analysis to measure a company’s performance over the most recent twelve-month period. It provides a snapshot of the company’s financial health and helps in evaluating its growth and profitability.
The LTM calculation includes the financial data from the previous twelve months, which can be quarterly or annual data, depending on the reporting frequency of the company. It is commonly used in financial analysis to compare the company’s performance with its competitors or industry benchmarks.
To calculate the LTM, the financial data for the most recent twelve months is summed up. This includes revenue, net income, earnings per share, cash flow, or any other financial metric that is relevant to the analysis. By considering the data from the past twelve months, the LTM provides a more up-to-date and comprehensive view of the company’s performance compared to using only the most recent quarter or year.
The LTM is particularly useful in analyzing companies that have seasonal fluctuations in their financial performance. By looking at the data over a twelve-month period, it smooths out the impact of seasonality and provides a more accurate representation of the company’s overall performance.
Investors, analysts, and financial professionals utilize the LTM in various ways. It helps in identifying trends, evaluating growth rates, assessing profitability, and making investment decisions. By comparing the LTM of different companies, investors can determine which company is performing better and make informed investment choices.
The Last Twelve Months (LTM) is a financial metric used in analysis to assess a company’s performance over the most recent twelve-month period. It provides a snapshot of a company’s financial health and helps investors and analysts make informed decisions.
Calculation of Last Twelve Months (LTM)
The LTM calculation involves summing the financial data of a company for the past twelve consecutive months. This includes revenue, net income, EBITDA, and other key financial metrics. By considering a longer time period, the LTM provides a more comprehensive view of a company’s performance compared to shorter-term measures.
Benefits of Using Last Twelve Months (LTM)
Using the LTM metric offers several advantages in financial analysis. Firstly, it helps smooth out any seasonality or cyclical fluctuations that may occur in a company’s financials. By considering a full year of data, the LTM provides a more accurate representation of a company’s overall performance.
Additionally, the LTM allows for easy comparison between companies within the same industry. Since it covers the same time period, it eliminates any bias that may arise from using different fiscal year ends. This makes it easier to benchmark and evaluate companies’ financial performance.
Furthermore, the LTM can be used to identify trends and patterns in a company’s financials. By analyzing the LTM data over multiple periods, analysts can identify if a company’s performance is improving or declining. This information is valuable for making investment decisions and assessing the overall financial health of a company.
Limitations of Last Twelve Months (LTM)
While the LTM provides a comprehensive view of a company’s financial performance, it also has some limitations. Firstly, it relies on historical data and may not capture the most up-to-date information. Therefore, it should be used in conjunction with other financial metrics and current market conditions.
Additionally, the LTM may not be suitable for companies undergoing significant changes or experiencing rapid growth or decline. In such cases, it may be more appropriate to use other measures, such as quarterly or annual data, to assess the company’s performance.
How Last Twelve Months (LTM) is Used in Analysis
When conducting financial analysis, one of the key metrics used is the Last Twelve Months (LTM) figure. LTM provides a comprehensive view of a company’s financial performance over the past year, allowing analysts to assess its growth, profitability, and overall financial health.
1. Comparing Performance Over Time
For example, if a company’s LTM revenue has been consistently increasing over the past year, it indicates a positive growth trend. Conversely, if the LTM revenue has been declining, it may signal a decline in sales or market share.
2. Assessing Seasonality and Cyclical Trends
LTM figures are particularly useful for companies that experience seasonality or cyclical fluctuations in their business. By analyzing the LTM data, analysts can identify the impact of these factors on the company’s financial performance.
For instance, a retail company may experience higher sales during the holiday season. By comparing the LTM figures, analysts can determine the extent to which the company’s revenue increases during this period and adjust their projections accordingly.
3. Evaluating Financial Ratios

LTM figures are also used to calculate various financial ratios, which provide insights into a company’s liquidity, profitability, and efficiency. By using LTM data, analysts can ensure that the ratios reflect the most recent financial performance.
For example, the LTM earnings before interest, taxes, depreciation, and amortization (EBITDA) can be divided by the LTM revenue to calculate the EBITDA margin. This ratio indicates the company’s operating profitability over the past year.
4. Making Investment Decisions
Investors and financial institutions often use LTM figures to make informed investment decisions. By analyzing a company’s LTM financials, they can assess its financial stability, growth potential, and valuation.
For example, if a company has consistently high LTM revenue and profitability, it may be considered a good investment opportunity. On the other hand, if the LTM figures show declining performance or financial instability, investors may be cautious about investing in the company.
Utilizing Last Twelve Months LTM in Financial Analysis
When conducting financial analysis, the Last Twelve Months (LTM) metric is a valuable tool that provides a comprehensive view of a company’s performance over the past year. By considering the LTM, analysts can gain insights into the company’s financial health and make informed decisions.
Why is LTM important?
The LTM metric takes into account the most recent twelve months of a company’s financial data, including revenue, expenses, and profitability. This allows analysts to assess the company’s current financial status and trends, providing a more accurate picture than just looking at a single point in time.
By utilizing the LTM, analysts can identify any seasonal or cyclical patterns in the company’s performance. For example, if a company experiences higher sales during certain months of the year, the LTM metric can help smooth out these fluctuations and provide a more accurate representation of the company’s overall performance.
How is LTM calculated?
The LTM metric is calculated by summing the financial data from the most recent four quarters. This includes the income statement, balance sheet, and cash flow statement. By aggregating data from multiple periods, the LTM metric provides a more comprehensive view of the company’s financial performance.
When calculating the LTM, it is important to ensure that the data used is consistent and reflects the company’s ongoing operations. This may involve adjusting for any one-time or non-recurring events that could skew the results.
Benefits of using LTM in financial analysis
Utilizing the LTM metric in financial analysis offers several benefits:
- Accurate representation: By considering the most recent twelve months of data, the LTM metric provides a more accurate representation of a company’s financial performance.
- Trend analysis: The LTM metric allows analysts to identify trends and patterns in a company’s financials, helping to forecast future performance.
- Comparability: By using the LTM metric, analysts can compare the performance of different companies or industry peers on a consistent basis.
- Decision-making: The LTM metric provides valuable insights for decision-making, such as evaluating investment opportunities or assessing the financial health of a company.

Emily Bibb simplifies finance through bestselling books and articles, bridging complex concepts for everyday understanding. Engaging audiences via social media, she shares insights for financial success. Active in seminars and philanthropy, Bibb aims to create a more financially informed society, driven by her passion for empowering others.