
Klinger Oscillator: A Comprehensive Guide to Formulas and Calculations
The Klinger Oscillator is a technical analysis tool that helps traders and investors analyze the volume and price movements of a security. It was developed by Stephen J. Klinger and is used to identify potential trend reversals and confirm the strength of a trend.
The Klinger Oscillator is based on the concept of volume accumulation and distribution. It calculates the difference between the volume flowing into and out of a security over a specific period of time. This difference is then plotted as a histogram, which oscillates above and below a zero line.
The Klinger Oscillator consists of two main components: the Volume Force (VF) and the True Volume (TV). The Volume Force is calculated by multiplying the difference between the high and low prices of a security by the volume traded. The True Volume is calculated by taking the absolute value of the difference between the current closing price and the previous closing price, multiplied by the volume traded.
Key Components and Formulas
To calculate the Klinger Oscillator, you need to follow these steps:
- Calculate the Volume Force (VF) for each period by multiplying the difference between the high and low prices by the volume traded.
- Calculate the True Volume (TV) for each period by taking the absolute value of the difference between the current closing price and the previous closing price, multiplied by the volume traded.
- Calculate the 34-period exponential moving average (EMA) of the Volume Force (VF) and the True Volume (TV).
- Calculate the 55-period exponential moving average (EMA) of the Volume Force (VF) and the True Volume (TV).
- Subtract the 34-period EMA from the 55-period EMA to get the Klinger Oscillator value for each period.
Interpreting Klinger Oscillator Readings
The Klinger Oscillator can provide valuable insights into the strength and direction of a trend. When the Klinger Oscillator is above the zero line, it indicates that buying pressure is stronger than selling pressure, suggesting a bullish trend. Conversely, when the Klinger Oscillator is below the zero line, it indicates that selling pressure is stronger than buying pressure, suggesting a bearish trend.
Traders can also look for divergences between the Klinger Oscillator and the price of a security. Bullish divergences occur when the Klinger Oscillator makes a higher low while the price makes a lower low, indicating a potential trend reversal to the upside. Bearish divergences occur when the Klinger Oscillator makes a lower high while the price makes a higher high, indicating a potential trend reversal to the downside.
Using the Klinger Oscillator in Technical Analysis
The Klinger Oscillator can be used in conjunction with other technical analysis tools to confirm trading signals and identify potential entry and exit points. Traders can use it to confirm the strength of a trend, identify overbought and oversold conditions, and spot potential trend reversals.
It is important to note that the Klinger Oscillator should not be used in isolation and should be used in conjunction with other technical indicators and analysis techniques to make informed trading decisions.
Limitations and Considerations
Like any technical analysis tool, the Klinger Oscillator has its limitations. It is not foolproof and can generate false signals, especially in volatile and choppy markets. Traders should always use it in conjunction with other indicators and analysis techniques to confirm trading signals.
Additionally, the Klinger Oscillator is best suited for analyzing stocks and other securities with high trading volumes. It may not be as effective for analyzing low-volume securities or those with limited price and volume data.
The Klinger Oscillator is a technical analysis tool that helps traders and investors determine the strength and direction of a trend in the financial markets. It was developed by Stephen Klinger and is based on the concept of volume analysis.
What is the Klinger Oscillator?
The Klinger Oscillator is a momentum indicator that combines price and volume data to generate trading signals. It is calculated by taking the difference between two exponential moving averages (EMAs) of volume, and then multiplying it by the rate of change (ROC) of the price. The result is a line that oscillates above and below a zero line, indicating whether buying or selling pressure is dominant in the market.
How does it work?
The Klinger Oscillator is based on the idea that volume precedes price movements. When there is a divergence between the Klinger Oscillator and the price, it suggests a potential reversal or continuation of the trend. If the Klinger Oscillator is rising while the price is falling, it indicates buying pressure and a potential bullish signal. Conversely, if the Klinger Oscillator is falling while the price is rising, it suggests selling pressure and a potential bearish signal.
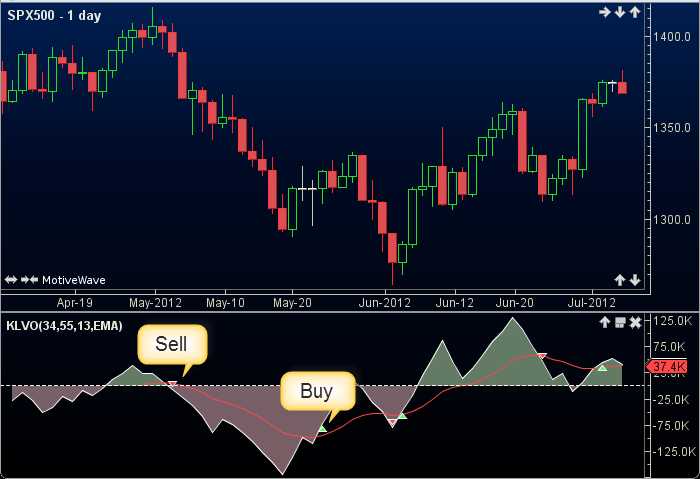
The Klinger Oscillator also incorporates a signal line, which is a moving average of the oscillator itself. When the oscillator crosses above the signal line, it generates a buy signal, and when it crosses below the signal line, it generates a sell signal.
How to interpret the readings?
Traders and investors can interpret the readings of the Klinger Oscillator in several ways. When the oscillator is above the zero line, it indicates bullish momentum, and when it is below the zero line, it indicates bearish momentum. The further the oscillator is from the zero line, the stronger the momentum. Additionally, traders can look for divergences between the oscillator and the price to identify potential trend reversals.
Using the Klinger Oscillator in Technical Analysis
The Klinger Oscillator can be used in conjunction with other technical analysis tools to confirm trading signals. For example, traders may use it in combination with trend lines, support and resistance levels, or other momentum indicators to increase the probability of successful trades. It is important to note that the Klinger Oscillator is not a standalone indicator and should be used as part of a comprehensive trading strategy.
Limitations and Considerations
While the Klinger Oscillator can be a useful tool in technical analysis, it is not without limitations. Like any other indicator, it is not foolproof and can generate false signals. Traders should always use it in conjunction with other indicators and analysis techniques to confirm trading decisions. Additionally, the Klinger Oscillator may not work well in certain market conditions or for certain financial instruments, so it is important to test and adjust its parameters accordingly.
Key Components and Formulas
The Klinger Oscillator is based on two key components: the Volume Force and the Accumulation Distribution Force. These components are calculated using specific formulas.
The Volume Force is calculated by taking the difference between the current volume and the volume from a certain number of periods ago. This calculation is then multiplied by the difference between the closing price and the average price for the same number of periods. The result is a value that represents the strength of the volume in relation to price movement.
The Accumulation Distribution Force is calculated by taking the difference between the current closing price and the average price for a certain number of periods. This calculation is then multiplied by the volume for the same number of periods. The result is a value that represents the strength of the price movement in relation to volume.
Once the Volume Force and Accumulation Distribution Force are calculated, they are combined to create the Klinger Oscillator. The Klinger Oscillator is calculated by taking the difference between the Volume Force and the Accumulation Distribution Force. This difference is then smoothed using a moving average to create a more stable and readable indicator.
The Klinger Oscillator is typically displayed as a line chart, with positive values indicating bullish sentiment and negative values indicating bearish sentiment. Traders can use the Klinger Oscillator to identify potential trend reversals, confirm price breakouts, and generate buy or sell signals.
It is important to note that the Klinger Oscillator is just one tool in a trader’s toolbox and should be used in conjunction with other technical analysis indicators and tools. It is also important to consider the limitations and considerations of the Klinger Oscillator, such as its sensitivity to short-term price fluctuations and its reliance on volume data.
Interpreting Klinger Oscillator Readings
When using the Klinger Oscillator in technical analysis, it is important to understand how to interpret its readings. The oscillator provides valuable insights into the strength and direction of price trends, helping traders make informed decisions.
The Klinger Oscillator consists of two lines: the Klinger Volume Oscillator (KVO) and the Signal Line. The KVO measures the difference between the short-term and long-term volume trends, while the Signal Line is a moving average of the KVO. By analyzing the relationship between these two lines, traders can identify potential buying or selling opportunities.
Positive readings on the Klinger Oscillator indicate that the volume is increasing, suggesting a bullish trend. Conversely, negative readings indicate decreasing volume, signaling a bearish trend. Traders can look for divergences between the price and the oscillator to identify potential reversals or trend continuations.
When the KVO crosses above the Signal Line, it generates a bullish signal, indicating that buying pressure is increasing. Conversely, when the KVO crosses below the Signal Line, it generates a bearish signal, indicating that selling pressure is increasing. Traders can use these crossover signals to enter or exit positions.
Additionally, the Klinger Oscillator can be used to identify overbought or oversold conditions. When the oscillator reaches extreme levels, it suggests that the market may be due for a reversal. Traders can use this information to adjust their trading strategies accordingly.
It is important to note that the Klinger Oscillator is not infallible and should be used in conjunction with other technical analysis tools and indicators. It is also crucial to consider the overall market conditions and other factors that may influence price movements.
Using the Klinger Oscillator in Technical Analysis
1. Identifying Trend Strength
One of the main uses of the Klinger Oscillator is to identify the strength of a trend. When the Klinger Oscillator is positive, it indicates that buying pressure is stronger than selling pressure, suggesting a bullish trend. Conversely, when the Klinger Oscillator is negative, it indicates that selling pressure is stronger than buying pressure, suggesting a bearish trend. Traders can use this information to confirm the strength of a trend and potentially enter or exit positions.
2. Spotting Divergences
Another valuable application of the Klinger Oscillator is spotting divergences between the oscillator and the price of the asset being analyzed. Divergences occur when the price of an asset is moving in one direction, while the Klinger Oscillator is moving in the opposite direction. This can be a sign of a potential trend reversal or a weakening trend. Traders can use divergences as a signal to enter or exit positions or to adjust their trading strategies.
3. Confirming Breakouts
The Klinger Oscillator can also be used to confirm breakouts from key levels of support or resistance. When the price of an asset breaks above a resistance level and the Klinger Oscillator is positive, it can be a confirmation of a bullish breakout. Similarly, when the price breaks below a support level and the Klinger Oscillator is negative, it can confirm a bearish breakout. Traders can use this confirmation to validate their trading decisions and potentially increase the probability of a successful trade.
Limitations and Considerations
While the Klinger Oscillator is a useful tool in technical analysis, it is important to understand its limitations and consider other factors when making trading decisions. Here are some key limitations and considerations to keep in mind:
1. False Signals
Like any technical indicator, the Klinger Oscillator is not infallible and can generate false signals. Traders should not rely solely on the oscillator’s readings and should use other indicators and analysis techniques to confirm signals.
2. Market Conditions
The Klinger Oscillator is most effective in trending markets where there is a clear direction. In choppy or sideways markets, the oscillator may produce inconsistent or conflicting signals. Traders should consider the overall market conditions before relying solely on the oscillator’s readings.
3. Lagging Indicator
The Klinger Oscillator is a lagging indicator, meaning it is based on past price data. It may not provide timely signals for fast-moving markets or sudden price reversals. Traders should be aware of this lag and use the oscillator in conjunction with other leading indicators for more accurate analysis.
4. Subjectivity
Interpreting the Klinger Oscillator’s readings can be subjective and open to interpretation. Traders may have different thresholds for determining overbought or oversold conditions, leading to varying trading decisions. It is important to establish clear criteria and guidelines for interpreting the oscillator’s readings.
5. Backtesting and Optimization
Before using the Klinger Oscillator in live trading, it is recommended to backtest and optimize the indicator on historical data. This helps to understand its performance, strengths, and weaknesses in different market conditions. Traders should also regularly review and update their trading strategies based on new data and market dynamics.
| Advantages | Limitations |
|---|---|
| – Provides insight into buying and selling pressure | – Can generate false signals |
| – Helps identify trend reversals | – Inconsistent signals in choppy markets |
| – Can be used in conjunction with other indicators | – Lagging indicator |
| – Easy to calculate and interpret | – Subjective interpretation |
| – Can be backtested and optimized | – Requires regular review and update |
Overall, the Klinger Oscillator is a valuable tool in technical analysis, but it should not be used in isolation. Traders should consider its limitations and combine it with other indicators and analysis techniques for more accurate and reliable trading decisions.

Emily Bibb simplifies finance through bestselling books and articles, bridging complex concepts for everyday understanding. Engaging audiences via social media, she shares insights for financial success. Active in seminars and philanthropy, Bibb aims to create a more financially informed society, driven by her passion for empowering others.