
What is Double Exponential Moving Average (DEMA)?
Double Exponential Moving Average (DEMA) is a technical analysis indicator that is used to smooth out price data and identify trends in financial markets. It is a variation of the simple moving average (SMA) and the exponential moving average (EMA).
The DEMA is calculated using a two-step process. First, the EMA is calculated using a specified period. Then, another EMA is calculated using the EMA values from the first step. Finally, the DEMA is calculated by subtracting the second EMA from twice the first EMA.
The DEMA is considered to be more responsive to price changes compared to other moving averages. It is often used by traders and analysts to identify potential buy and sell signals, as well as to confirm the strength of a trend.
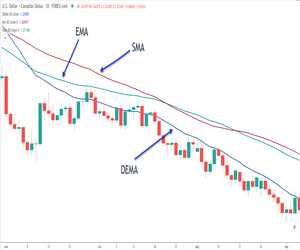
The DEMA can be plotted on a price chart to visually represent the trend. When the DEMA is rising, it indicates an uptrend, while a falling DEMA indicates a downtrend. Traders may use crossovers of the DEMA with the price or other moving averages as signals to enter or exit trades.
It is important to note that the DEMA, like other technical indicators, should not be used in isolation. It is best used in conjunction with other indicators and analysis techniques to make informed trading decisions.
| Advantages of DEMA | Disadvantages of DEMA |
|---|---|
| – More responsive to price changes | – Can produce false signals in choppy markets |
| – Helps identify trends | – Lagging indicator |
| – Can be used in various timeframes | – Requires additional analysis for confirmation |
Definition and Formula
The Double Exponential Moving Average (DEMA) is a technical indicator used in financial markets to analyze price trends. It is a variation of the simple moving average (SMA) and the exponential moving average (EMA). The DEMA is designed to reduce lag and provide a more accurate representation of price movements.
The formula for calculating the DEMA involves two steps. First, calculate the single exponential moving average (EMA) of the price data. Then, calculate the EMA of the EMA from the first step. The formula for the DEMA is as follows:
Where:
- EMA(n) is the exponential moving average of the price data over a specified period (n).
- EMA(EMA(n)) is the exponential moving average of the EMA from the first step.
The DEMA is typically used in conjunction with other technical indicators and chart patterns to make trading decisions. Traders look for crossovers between the DEMA and the price data, as well as divergences between the DEMA and other indicators, to identify potential buy or sell signals.
It is important to note that the DEMA, like any other technical indicator, is not a standalone tool for making trading decisions. It should be used in combination with other analysis techniques and risk management strategies to increase the probability of successful trades.
| Advantages | Disadvantages |
|---|---|
|
|
Technical Analysis Basic Education
Technical analysis is a method used by traders and investors to forecast future price movements based on historical market data. It is based on the belief that market trends and patterns can be identified and used to predict future price movements. One of the tools used in technical analysis is the Double Exponential Moving Average (DEMA).
What is Double Exponential Moving Average (DEMA)?
The Double Exponential Moving Average (DEMA) is a technical indicator that is used to smooth out price fluctuations and identify trends in the market. It is a variation of the Exponential Moving Average (EMA) and is designed to give more weight to recent price data.
The DEMA is calculated using a two-step process. First, the EMA is calculated using the formula:
where n is the number of periods used in the calculation. The EMA is then used to calculate the DEMA using the formula:
DEMA Calculation and Interpretation
The DEMA is calculated by taking the difference between two EMAs and adding it to the current EMA. This calculation is repeated for each period, resulting in a line that represents the DEMA. Traders and investors use the DEMA to identify trends in the market and make decisions based on the direction of the DEMA line.
It is important to note that the DEMA is just one tool used in technical analysis and should be used in conjunction with other indicators and analysis methods. It is not a guarantee of future price movements and should be used as part of a larger trading strategy.
DEMA Calculation and Interpretation
The Double Exponential Moving Average (DEMA) is a technical indicator that is used to identify trends in price movements. It is calculated using a formula that takes into account the previous values of the DEMA and the current price.
To calculate the DEMA, you first need to calculate the EMA (Exponential Moving Average) for a given period. The EMA is calculated using the formula:
EMA Calculation
Once you have calculated the EMA, you can then calculate the DEMA using the formula:
DEMA Calculation
The DEMA is a smoother version of the EMA, as it takes into account the previous values of the EMA. This helps to reduce the lag in the indicator and provides a more accurate representation of the trend.
Interpreting the DEMA is similar to interpreting other moving averages. When the DEMA is rising, it indicates that the price is in an uptrend. Conversely, when the DEMA is falling, it indicates that the price is in a downtrend.
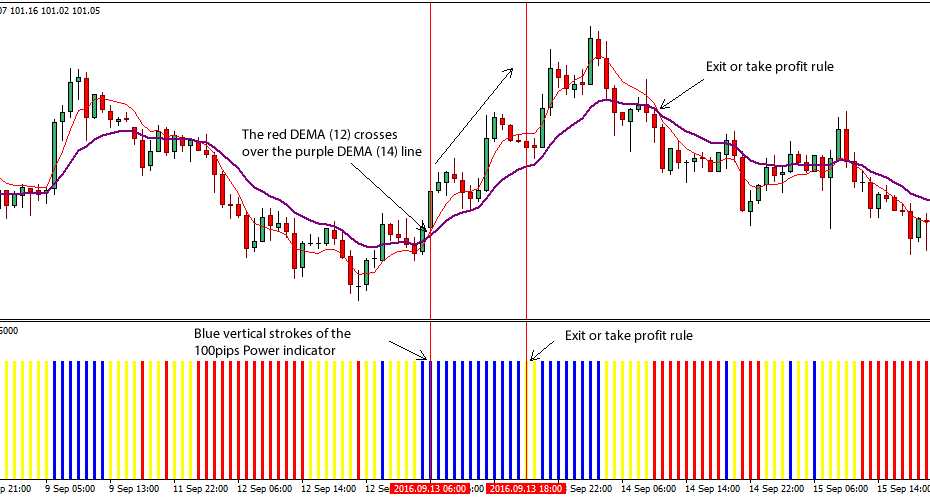
Traders often use the DEMA in conjunction with other technical indicators to confirm trend reversals and identify potential entry and exit points. For example, if the DEMA crosses above a shorter-term moving average, it may signal a bullish trend reversal and a potential buying opportunity.
It is important to note that the DEMA, like any other technical indicator, is not foolproof and should be used in conjunction with other analysis techniques. It is also important to consider other factors such as market conditions, volume, and news events when making trading decisions.
| Advantages | Disadvantages |
|---|---|
| – Provides a smoother representation of price trends | – Lagging indicator, may not provide timely signals |
| – Helps to identify trend reversals | – Can produce false signals in choppy or sideways markets |
| – Can be used in conjunction with other indicators for confirmation |

Emily Bibb simplifies finance through bestselling books and articles, bridging complex concepts for everyday understanding. Engaging audiences via social media, she shares insights for financial success. Active in seminars and philanthropy, Bibb aims to create a more financially informed society, driven by her passion for empowering others.