
Candlestick Chart Definition and Basics Explained
A candlestick chart is a type of financial chart used to represent the price movement of an asset, such as a stock, currency, or commodity, over a specific period of time. It is widely used in technical analysis to identify patterns and trends that can help traders make informed trading decisions.
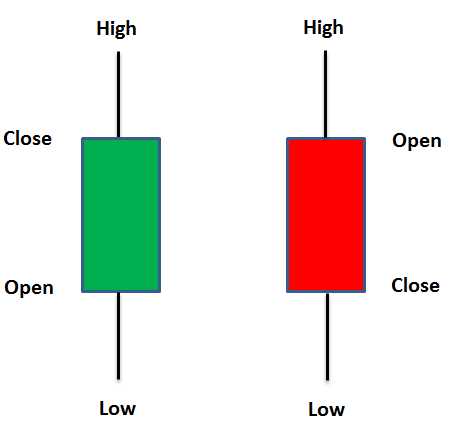
The basic structure of a candlestick chart consists of individual “candles” that represent a specified time period, typically a day, week, or month. Each candle is composed of four main components: the opening price, the closing price, the high price, and the low price.
The body of the candle is represented by a rectangular shape, with the opening price at one end and the closing price at the other end. The color of the body can vary, with green or white typically indicating a price increase and red or black indicating a price decrease.
The “wick” or “shadow” of the candle represents the high and low prices during the specified time period. The upper shadow extends from the top of the body to the high price, while the lower shadow extends from the bottom of the body to the low price.
Candlestick charts provide valuable information about the price action and sentiment of market participants. Traders can analyze the patterns and formations of the candles to identify potential reversals, continuations, or indecision in the market.
Some common candlestick patterns include doji, hammer, shooting star, engulfing, and spinning top. These patterns can provide insights into market psychology and can be used to predict future price movements.
What are Candlestick Charts?
Candlestick charts originated in Japan in the 18th century and have since gained popularity worldwide. They are visual representations of price movements and consist of individual “candles” that represent a specific time period, such as a day, week, or month.
Each candle on a candlestick chart has four main components: the open, high, low, and close. The body of the candle represents the price range between the open and close, while the wicks or shadows represent the high and low prices reached during the time period.
By analyzing the patterns and formations formed by these candles, traders can gain insights into market sentiment and potential future price movements.
Key Elements of Candlestick Charts
There are several key elements to consider when analyzing candlestick charts:
- Candle Colors: The color of the candle can indicate whether the price closed higher (green or white) or lower (red or black) than its opening price. This provides visual cues about bullish or bearish market sentiment.
- Candlestick Patterns: Candlestick patterns are specific formations that indicate potential reversals or continuations in price trends. Some common patterns include doji, hammer, engulfing, and shooting star.
- Support and Resistance Levels: Candlestick charts can help identify key support and resistance levels, which are price levels where the asset has historically struggled to move above or below. These levels can act as barriers or turning points for future price movements.
- Volume: Volume is often displayed alongside candlestick charts and provides information about the strength of price movements. High volume during bullish or bearish candles can indicate strong market participation and validate the reliability of the chart pattern.
Interpreting Candlestick Patterns
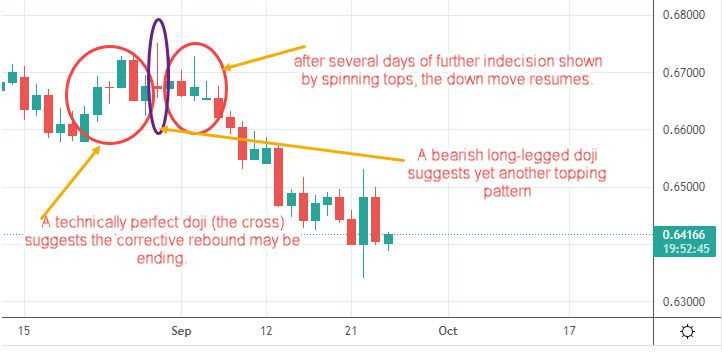
Interpreting candlestick patterns is a crucial skill for technical analysts. Different patterns can suggest different market conditions and potential trading opportunities. For example, a doji candlestick pattern, which has a small body and long wicks, indicates indecision in the market and can signal a potential reversal.
Traders can combine multiple candlestick patterns and other technical indicators to confirm their analysis and make more accurate predictions about future price movements.
Using Candlestick Charts for Trading Decisions
It is important to note that candlestick charts should not be used in isolation but rather in conjunction with other technical analysis tools and indicators. Combining multiple sources of information can increase the accuracy of trading decisions and reduce the risk of false signals.
Key Elements of Candlestick Charts
2. Candle Wick: The thin lines extending above and below the candle body are called wicks or shadows. The upper wick represents the highest price reached during the time period, while the lower wick represents the lowest price. Wicks provide information about the volatility and range of price movement.
3. Candle High and Low: The highest and lowest prices reached during the time period are represented by the top and bottom of the candle body, excluding the wicks. These levels are important for identifying support and resistance levels and determining potential price reversals.
4. Candlestick Patterns: Candlestick charts display various patterns that can provide valuable insights into market sentiment and potential future price movements. Common patterns include doji, hammer, shooting star, engulfing, and harami. Traders use these patterns to identify potential entry and exit points.
5. Time Period: Candlestick charts can be plotted for various time periods, such as minutes, hours, days, weeks, or months. The chosen time period depends on the trader’s trading style and the asset being analyzed. Shorter time periods provide more detailed information, while longer time periods show broader trends.
6. Volume: Volume is often displayed alongside candlestick charts and represents the number of shares or contracts traded during a given time period. Volume can confirm the validity of price movements and indicate the level of market participation.
7. Trendlines: Trendlines can be drawn on candlestick charts to identify and confirm trends. An upward trendline connects the higher lows, while a downward trendline connects the lower highs. Trendlines help traders determine the direction of the market and potential support and resistance levels.
8. Multiple Candlestick Patterns: Analyzing multiple candlestick patterns in succession can provide more accurate signals. For example, a bullish engulfing pattern followed by a long green candle may indicate a strong upward trend. Traders often look for confirmation from multiple patterns before making trading decisions.
Interpreting Candlestick Patterns
Candlestick patterns are a popular tool used in technical analysis to predict future price movements in financial markets. These patterns are formed by the open, high, low, and close prices of a particular asset over a given time period. By analyzing these patterns, traders can gain insights into market sentiment and make informed trading decisions.
Types of Candlestick Patterns
There are numerous candlestick patterns that traders use to interpret price action. Some of the most common patterns include:
- Doji: This pattern occurs when the open and close prices are very close to each other, resulting in a small or nonexistent body. It indicates indecision in the market.
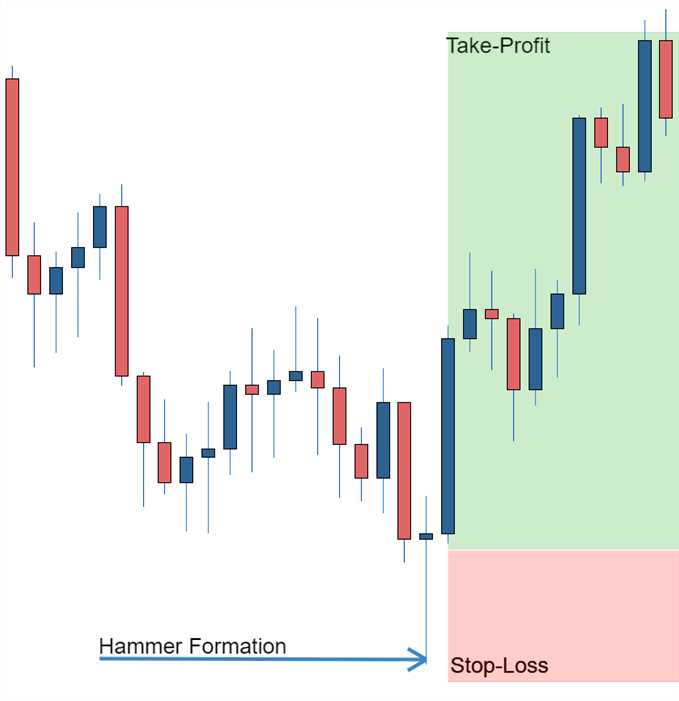
- Hammer: This pattern has a small body and a long lower shadow, indicating a potential reversal from a downtrend to an uptrend.
- Engulfing: This pattern occurs when a small candle is followed by a larger candle that completely engulfs the previous candle. It suggests a reversal in the market.
- Evening Star: This pattern is the opposite of the Morning Star pattern and indicates a potential reversal from an uptrend to a downtrend.
Interpreting Candlestick Patterns
When interpreting candlestick patterns, traders look for specific formations and combinations to identify potential market trends and reversals. Here are a few key points to consider:
- Confirmation: It is important to wait for confirmation before making any trading decisions based on candlestick patterns. This can be done by analyzing other technical indicators or waiting for the next candle to confirm the pattern.
- Context: The context in which a candlestick pattern appears is crucial. Traders need to consider the overall market trend, support and resistance levels, and other relevant factors to validate the pattern.
- Multiple Patterns: Traders often look for multiple candlestick patterns forming in succession to strengthen their analysis and increase the probability of a successful trade.
- Timeframes: Candlestick patterns can be analyzed on different timeframes, ranging from minutes to months. Traders should choose the timeframe that aligns with their trading strategy and goals.
It is important to note that candlestick patterns are not foolproof indicators and should be used in conjunction with other technical analysis tools and risk management strategies. Traders should also consider the overall market conditions and news events that may impact price movements.
Using Candlestick Charts for Trading Decisions
1. Identifying Candlestick Patterns
The first step in using candlestick charts for trading decisions is to learn how to identify different candlestick patterns. These patterns can provide important information about the market sentiment and potential price movements.
Some common candlestick patterns include:
| Pattern | Description |
|---|---|
| Doji | A candle with a small body, indicating indecision in the market. |
| Hammer | A candle with a small body and a long lower wick, signaling a potential reversal. |
| Engulfing | A candle that completely engulfs the previous candle, suggesting a reversal in the market. |
| Shooting Star | A candle with a small body and a long upper wick, indicating a potential reversal. |
2. Analyzing Candlestick Patterns
Once you have identified a candlestick pattern, the next step is to analyze it in the context of the overall market trend and other technical indicators. This can help confirm the validity of the pattern and provide additional insights.
For example, if you identify a hammer candlestick pattern after a prolonged downtrend, it could indicate a potential reversal in the market. However, it is important to consider other factors such as support and resistance levels, volume, and trendlines to confirm the signal.
3. Making Trading Decisions
After analyzing the candlestick patterns and considering other technical indicators, traders can use this information to make more informed trading decisions. This could include entering a trade, setting stop-loss orders, or adjusting position sizes.

Emily Bibb simplifies finance through bestselling books and articles, bridging complex concepts for everyday understanding. Engaging audiences via social media, she shares insights for financial success. Active in seminars and philanthropy, Bibb aims to create a more financially informed society, driven by her passion for empowering others.