
What is Capital Market Line?
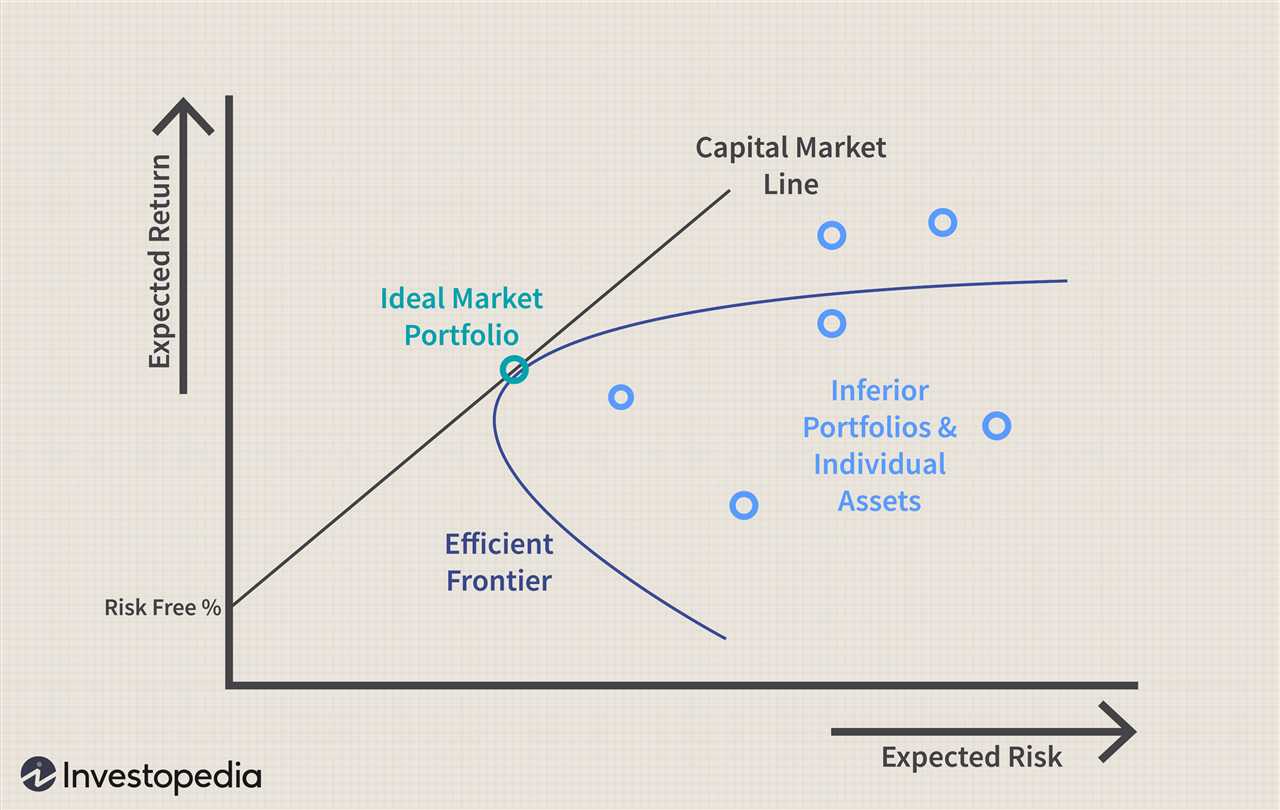
The Capital Market Line (CML) is a graphical representation of the risk-return tradeoff for a portfolio of risky assets. It shows the relationship between the expected return and the standard deviation of a portfolio. The CML is derived from the efficient frontier, which represents the set of portfolios that offer the highest expected return for a given level of risk.
The CML is a key concept in modern portfolio theory, which aims to maximize returns for a given level of risk. It is based on the idea that investors are risk-averse and require compensation for taking on additional risk. The CML helps investors understand the tradeoff between risk and return and allows them to make informed investment decisions.
The CML is represented by a straight line that starts at the risk-free rate of return and passes through the efficient frontier. The risk-free rate represents the return on an investment with no risk, such as a government bond. The slope of the CML represents the risk premium, which is the additional return an investor expects for taking on additional risk.
Calculating the CML
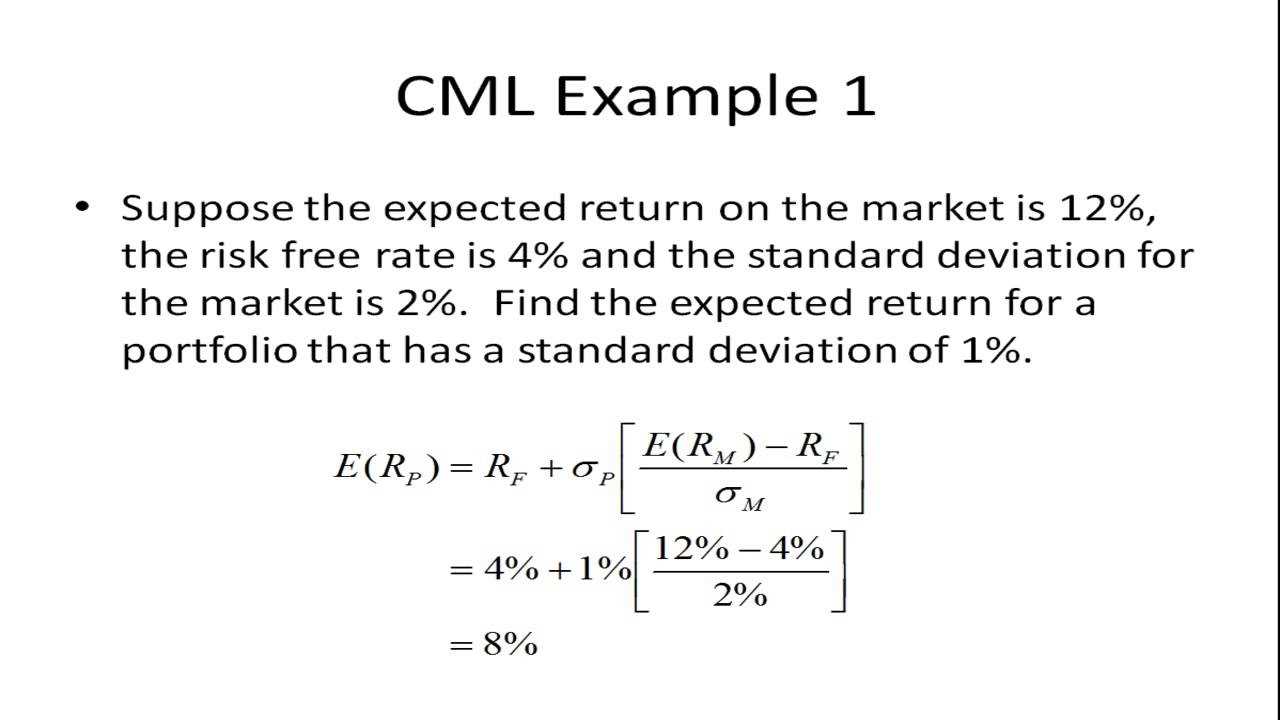
- Expected Return of Portfolio = Weighted Average of the Expected Returns of the Individual Assets
- Standard Deviation of Portfolio = Square Root of the Weighted Sum of the Variances of the Individual Assets + 2 * Weighted Sum of the Covariances between the Individual Assets
Once you have calculated the expected return and standard deviation of the portfolio, you can plot it on the CML and determine the risk premium and optimal portfolio.
How to Calculate Capital Market Line
The Capital Market Line (CML) is a graphical representation of the relationship between risk and expected return for efficient portfolios. It helps investors understand the trade-off between risk and return and make informed investment decisions. Calculating the CML involves several steps:
Step 1: Calculate the Risk-Free Rate
The first step in calculating the CML is to determine the risk-free rate of return. The risk-free rate is the return on an investment with zero risk, typically represented by the yield on government bonds. This rate serves as a benchmark for comparing the expected returns of other investments.
Step 2: Calculate the Expected Return and Standard Deviation of the Market Portfolio
The market portfolio is a diversified portfolio that includes all available assets in the market, weighted according to their market values. To calculate the expected return and standard deviation of the market portfolio, you need historical data on the returns of different assets and their respective weights in the market.
Step 3: Calculate the Market Risk Premium
The market risk premium is the difference between the expected return of the market portfolio and the risk-free rate. It represents the additional return investors require for taking on the systematic risk associated with investing in the market.
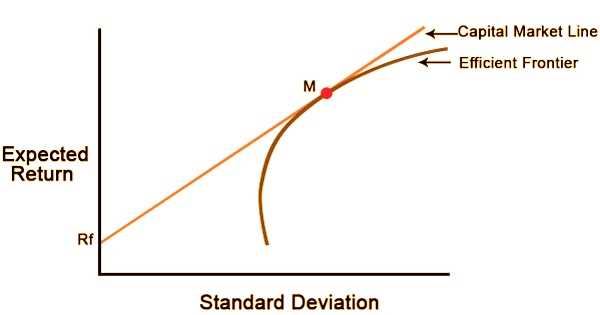
Step 4: Plot the Capital Market Line
Once you have the risk-free rate, expected return, standard deviation of the market portfolio, and market risk premium, you can plot the CML on a graph. The CML is a straight line that starts at the risk-free rate and passes through the market portfolio. The slope of the CML represents the risk premium per unit of risk.
Step 5: Evaluate Investment Opportunities
| Step | Action |
|---|---|
| Step 1 | Calculate the Risk-Free Rate |
| Step 2 | Calculate the Expected Return and Standard Deviation of the Market Portfolio |
| Step 3 | Calculate the Market Risk Premium |
| Step 4 | Plot the Capital Market Line |
| Step 5 | Evaluate Investment Opportunities |
By following these steps, investors can calculate the Capital Market Line and use it as a tool to make informed investment decisions based on the trade-off between risk and return.

Emily Bibb simplifies finance through bestselling books and articles, bridging complex concepts for everyday understanding. Engaging audiences via social media, she shares insights for financial success. Active in seminars and philanthropy, Bibb aims to create a more financially informed society, driven by her passion for empowering others.