
What is On-Balance Volume (OBV)?
On-Balance Volume (OBV) is a technical analysis indicator that measures the positive and negative volume flow in a particular security or market. It provides insights into the strength of buying and selling pressure, helping traders and investors make informed decisions.
OBV is based on the premise that volume precedes price movement. It was developed by Joseph Granville in the 1960s and has since become a popular tool among technical analysts.
The indicator is calculated by adding the volume on days when the price closes higher and subtracting the volume on days when the price closes lower. The cumulative total is then plotted on a chart, creating a line that either confirms or contradicts the price trend.
OBV can be used to identify trends, confirm breakouts, and generate trading signals. When the OBV line is trending upwards and diverging from the price, it suggests that buying pressure is increasing and the price is likely to rise. Conversely, when the OBV line is trending downwards and diverging from the price, it indicates that selling pressure is increasing and the price is likely to decline.
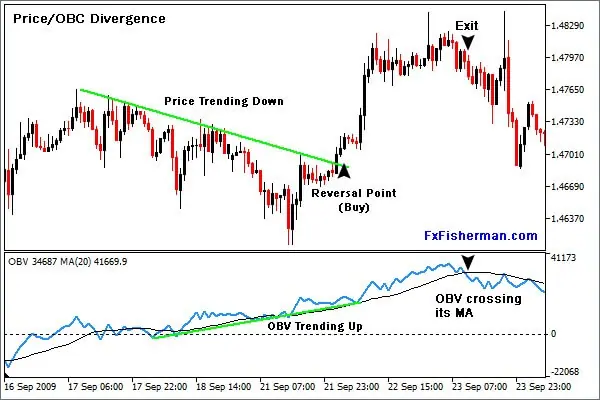
Traders often look for divergences between the OBV line and the price to identify potential reversals or trend continuations. For example, if the price is making higher highs, but the OBV line is making lower highs, it could be a sign that the uptrend is losing momentum and a reversal may be imminent.
In addition to trend analysis, OBV can also be used to confirm breakouts. When the price breaks above a resistance level and the OBV line confirms the breakout by also moving higher, it suggests that the breakout is legitimate and the price is likely to continue rising. Conversely, if the price breaks below a support level and the OBV line confirms the breakout by also moving lower, it suggests that the breakout is valid and the price is likely to continue declining.
Definition and Explanation
The On-Balance Volume (OBV) is a technical analysis indicator that measures the cumulative flow of volume in a particular asset or security. It was developed by Joseph Granville in the 1960s and is used to predict price movements and identify potential trends.
OBV is based on the premise that volume precedes price movement. It takes into account the volume traded during up and down days and assigns a positive or negative value accordingly. The OBV line is then plotted on a chart to provide a visual representation of the volume flow.
When the OBV line is trending upwards, it suggests that buying pressure is increasing and that the asset’s price is likely to rise. Conversely, when the OBV line is trending downwards, it indicates that selling pressure is increasing and that the asset’s price is likely to decline.
How does OBV work?
OBV works by accumulating volume on up days and subtracting volume on down days. The formula for calculating OBV is as follows:
OBV = Previous OBV + Current Volume
If the current day’s closing price is higher than the previous day’s closing price, the volume is added to the OBV. If the current day’s closing price is lower, the volume is subtracted from the OBV. If the closing prices are the same, the volume is ignored.
By tracking the cumulative volume flow, OBV attempts to identify periods of accumulation or distribution. Accumulation occurs when the OBV line is rising, indicating that more volume is being traded on up days. This suggests that smart money is buying the asset. Distribution, on the other hand, occurs when the OBV line is falling, indicating that more volume is being traded on down days. This suggests that smart money is selling the asset.
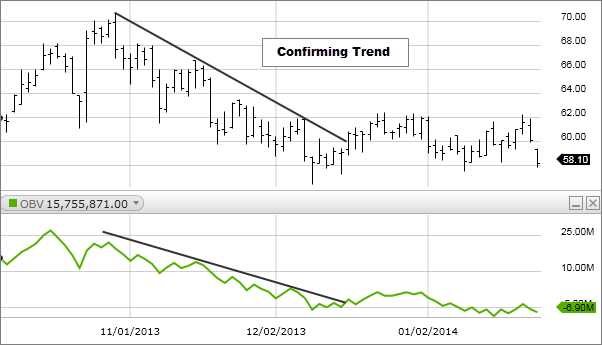
OBV can be used in conjunction with other technical analysis tools to confirm trends and generate trading signals. For example, if the OBV line is trending upwards while the price is also rising, it may indicate a strong bullish trend. Conversely, if the OBV line is trending downwards while the price is falling, it may indicate a strong bearish trend.
Overall, OBV is a useful tool for traders and investors to gauge the strength of buying and selling pressure in the market. It can help identify potential trend reversals and provide insights into market sentiment. However, like any technical analysis indicator, it is not foolproof and should be used in conjunction with other analysis techniques for more accurate predictions.
Formula for Calculating OBV
The On-Balance Volume (OBV) is calculated using a simple formula that takes into account the volume and price movements of a security. The formula is as follows:
Step 1: Initial OBV Calculation
- Start by setting the initial OBV value to zero.
- If the current closing price is higher than the previous closing price, add the current volume to the OBV.
- If the current closing price is lower than the previous closing price, subtract the current volume from the OBV.
Step 2: Calculate OBV for Subsequent Periods
- For each subsequent period, repeat the following steps:
- If the current closing price is higher than the previous closing price, add the current volume to the previous OBV.
- If the current closing price is lower than the previous closing price, subtract the current volume from the previous OBV.
The OBV is typically displayed as a line chart that moves up or down depending on the buying or selling pressure. Traders and analysts use the OBV to identify trends and confirm the strength of a price movement. A rising OBV indicates buying pressure, while a falling OBV suggests selling pressure.
By analyzing the OBV in conjunction with price movements, traders can make more informed decisions about when to buy or sell a security. For example, if the OBV is rising while the price is also increasing, it may indicate that the uptrend is strong and likely to continue. Conversely, if the OBV is falling while the price is rising, it may suggest that the uptrend is weakening and a reversal could be imminent.
Overall, the OBV is a useful tool for technical analysis and can provide valuable insights into the strength and direction of price movements. However, like any indicator, it should be used in conjunction with other analysis techniques to make well-informed trading decisions.
Uses of OBV as an Indicator
The On-Balance Volume (OBV) indicator is widely used by traders and analysts to identify trends and confirm price movements in the financial markets. It provides valuable insights into the buying and selling pressure behind a particular asset or security.
Here are some key uses of OBV as an indicator:
- Divergence Detection: OBV can help identify divergences between the price and the volume. If the price is making higher highs, but the OBV line is making lower highs, it signals a bearish divergence and a potential reversal in the price. Similarly, if the price is making lower lows, but the OBV line is making higher lows, it indicates a bullish divergence and a potential reversal in the price.
- Support and Resistance Levels: OBV can also be used to identify support and resistance levels. When the OBV line breaks above a previous high, it suggests that buying pressure is increasing and the price may continue to rise. On the other hand, if the OBV line breaks below a previous low, it indicates that selling pressure is increasing and the price may continue to decline.
- Volume Confirmation: OBV can confirm the validity of a price move. If the price is moving up, but the OBV line is flat or declining, it suggests that the buying pressure is weak and the price move may not be sustainable. Conversely, if the price is moving down, but the OBV line is flat or rising, it indicates that the selling pressure is weak and the price move may not be sustainable.
- Overbought and Oversold Conditions: OBV can be used to identify overbought and oversold conditions in the market. When the OBV line reaches extreme levels, such as a new high or a new low, it suggests that the market may be overbought or oversold, respectively. Traders can use this information to anticipate potential reversals in the price.
Overall, the On-Balance Volume (OBV) indicator is a powerful tool for technical analysis. It provides valuable insights into the buying and selling pressure in the market, helping traders and analysts make informed decisions. By incorporating OBV into their trading strategies, traders can enhance their ability to identify trends, confirm price movements, and anticipate potential reversals.
Technical Analysis Basic Education
Technical analysis is a method used by traders and investors to analyze and predict future price movements in financial markets. It is based on the belief that historical price data can provide insights into future price trends. One of the key tools used in technical analysis is the On-Balance Volume (OBV) indicator.
What is On-Balance Volume (OBV)?
On-Balance Volume (OBV) is a momentum indicator that measures the buying and selling pressure in a market. It was developed by Joseph Granville in the 1960s and is used to confirm price trends and predict potential reversals. OBV takes into account the volume of trades and whether the price closes higher or lower than the previous day.
Definition and Explanation
OBV is based on the principle that volume precedes price movement. When the volume is increasing along with the price, it suggests that there is strong buying pressure and the price is likely to continue rising. Conversely, when the volume is increasing along with a falling price, it indicates strong selling pressure and the price is likely to continue falling.
The OBV indicator is calculated by adding the volume on up days and subtracting the volume on down days. The resulting value is then added to the previous day’s OBV value. This cumulative total is used to plot the OBV line on a chart.
Formula for Calculating OBV
The formula for calculating OBV is as follows:
OBV = Previous OBV + Current Volume, if the price closes higher than the previous day
Uses of OBV as an Indicator
OBV is primarily used to confirm price trends and identify potential reversals. Traders and investors can use OBV to:
- Confirm uptrends and downtrends: When the OBV line is rising, it confirms an uptrend, indicating that buying pressure is increasing. When the OBV line is falling, it confirms a downtrend, indicating that selling pressure is increasing.
- Identify divergences: Divergences occur when the price is moving in one direction, but the OBV line is moving in the opposite direction. This can signal a potential reversal in the price trend.
- Spot buying and selling opportunities: Traders can look for OBV breakouts, where the OBV line moves above or below a trendline, indicating a potential buying or selling opportunity.
- Confirm support and resistance levels: When the OBV line breaks through a support or resistance level, it can confirm the strength of that level and indicate a potential price breakout or reversal.

Emily Bibb simplifies finance through bestselling books and articles, bridging complex concepts for everyday understanding. Engaging audiences via social media, she shares insights for financial success. Active in seminars and philanthropy, Bibb aims to create a more financially informed society, driven by her passion for empowering others.