
Moving Average (MA) Purpose
Moving Average (MA) is a widely used technical analysis tool that helps traders and investors identify trends and make informed decisions in the financial markets. It is a simple yet effective tool that smooths out price data over a specified period of time, providing a clearer picture of the overall trend.
Definition and Explanation
Moving Average is a calculation that is used to analyze historical price data and identify trends by averaging out the fluctuations. It is calculated by adding up a certain number of prices over a specific period and then dividing the sum by the number of prices. The resulting value is the moving average.
The purpose of using moving averages is to filter out short-term price fluctuations and noise, allowing traders to focus on the underlying trend. It helps in identifying support and resistance levels, as well as potential entry and exit points for trades.
Benefits and Uses
There are several benefits and uses of moving averages:
- Trend Identification: Moving averages help in identifying the direction of the trend. By comparing the current price to the moving average, traders can determine whether the market is in an uptrend, downtrend, or range-bound.
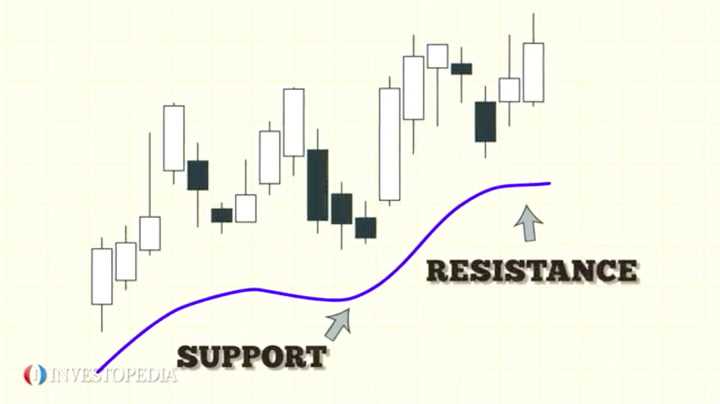
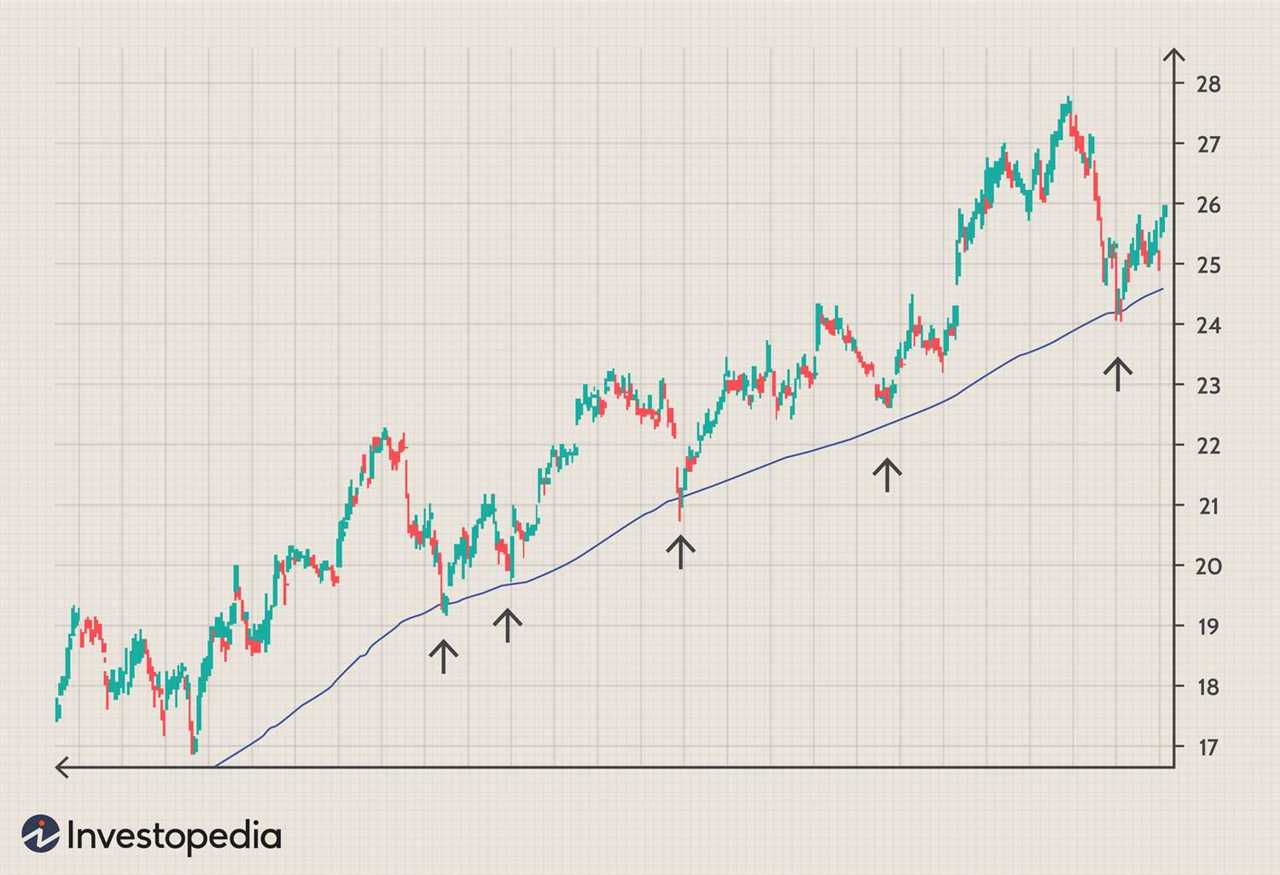
- Support and Resistance Levels: Moving averages act as dynamic support and resistance levels. Traders often use moving averages to identify potential areas of buying or selling pressure.
- Entry and Exit Points: Moving averages can be used to generate buy or sell signals. When the price crosses above the moving average, it may be a signal to buy, and when the price crosses below the moving average, it may be a signal to sell.
- Confirmation Tool: Moving averages can be used to confirm other technical indicators or patterns. For example, if a bullish pattern is forming and the price is above the moving average, it may provide additional confirmation of a potential uptrend.
Moving Average Formula
The formula for calculating the moving average depends on the type of moving average being used. The most commonly used types are the Simple Moving Average (SMA) and the Exponential Moving Average (EMA).
The Simple Moving Average (SMA) is calculated by adding up the closing prices over a specific period and dividing the sum by the number of periods.
The Exponential Moving Average (EMA) gives more weight to recent prices, making it more responsive to price changes. It is calculated using a formula that takes into account the previous EMA value and the current price.
Calculation Method
To calculate the moving average, follow these steps:
- Select the desired period for the moving average.
- Add up the closing prices over the selected period.
- Divide the sum by the number of periods to get the moving average.
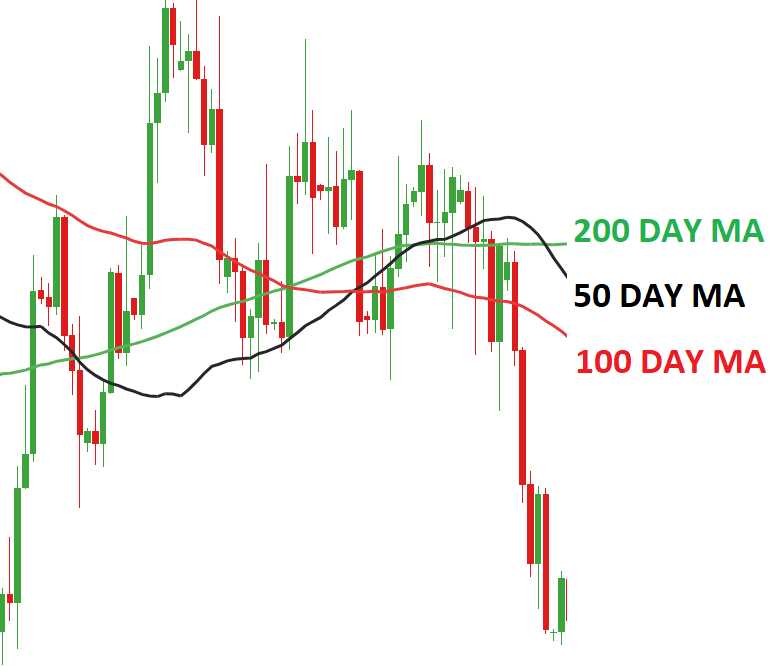
Types of Moving Averages
There are different types of moving averages, including:
- Simple Moving Average (SMA): The SMA gives equal weight to all prices over the selected period.
- Exponential Moving Average (EMA): The EMA gives more weight to recent prices, making it more responsive to price changes.
- Weighted Moving Average (WMA): The WMA assigns different weights to different prices, giving more importance to recent prices.
- Smoothed Moving Average (SMMA): The SMMA is a modified version of the SMA that assigns more weight to recent prices.
Each type of moving average has its own advantages and disadvantages, and traders can choose the one that best suits their trading style and objectives.
Definition and Explanation
Moving Average (MA) is a widely used technical analysis tool in the financial markets. It is a trend-following indicator that helps traders and investors identify the overall direction of a price trend. The MA is calculated by averaging the closing prices of a security over a specified period of time.
MA is used to smooth out price fluctuations and filter out noise in the market. It provides a clearer picture of the underlying trend by eliminating short-term price volatility. Traders use MA to identify potential buying or selling opportunities based on the crossover of different moving averages.
The concept behind MA is based on the assumption that prices tend to revert to their mean over time. By calculating the average price over a specific period, MA helps identify the average value of a security and provides a reference point for determining whether the current price is above or below the average.
MA is commonly used in conjunction with other technical indicators to confirm trading signals and improve the accuracy of predictions. It is a versatile tool that can be applied to various timeframes, such as daily, weekly, or monthly charts, depending on the trader’s preference and trading strategy.
Overall, Moving Average is a fundamental tool in technical analysis that helps traders and investors make informed decisions by providing a clear representation of price trends and potential reversal points.
| Benefits of Moving Average | Uses of Moving Average |
|---|---|
| 1. Smoothes out price fluctuations | 1. Identifying the overall trend |
| 2. Filters out market noise | 2. Identifying potential buying or selling opportunities |
| 3. Provides a reference point for determining average value | 3. Confirming trading signals |
| 4. Improves accuracy of predictions | 4. Determining potential reversal points |
Benefits and Uses of Moving Average (MA)
Moving Average (MA) is a widely used technical analysis tool in the financial markets. It is a trend-following indicator that helps traders and investors identify the direction of the market and make informed trading decisions. The MA is calculated by taking the average price of a security over a specified period of time, which smooths out the price fluctuations and provides a clearer picture of the overall trend.
Benefits of Moving Average (MA)
1. Trend Identification: One of the key benefits of using MA is its ability to identify trends in the market. By plotting the MA on a price chart, traders can easily determine whether the market is in an uptrend, downtrend, or range-bound. This information is crucial for making profitable trades and avoiding potential losses.
2. Support and Resistance Levels: MA can also act as dynamic support and resistance levels. When the price of a security is above the MA, it is considered a bullish signal, and the MA acts as a support level. Conversely, when the price is below the MA, it is a bearish signal, and the MA acts as a resistance level. Traders can use these levels to enter or exit trades.
3. Entry and Exit Points: MA can be used to determine optimal entry and exit points for trades. When the price crosses above the MA, it is a buy signal, indicating that the trend is turning bullish. On the other hand, when the price crosses below the MA, it is a sell signal, suggesting that the trend is turning bearish. Traders can use these signals to time their trades and maximize their profits.
Uses of Moving Average (MA)
1. Moving Average Crossover: Traders often use the crossover of two MAs as a trading strategy. When a shorter-term MA crosses above a longer-term MA, it is a bullish signal, indicating a potential uptrend. Conversely, when a shorter-term MA crosses below a longer-term MA, it is a bearish signal, indicating a potential downtrend. Traders can use these crossovers to enter or exit trades.
2. Moving Average as a Filter: MA can be used as a filter to confirm other technical indicators or trading signals. For example, if a trader receives a buy signal from another indicator, they may wait for the price to be above the MA before entering the trade. This helps to reduce false signals and increases the probability of a successful trade.
Moving Average (MA) Formula
The Moving Average (MA) formula is a widely used technical analysis tool that helps traders and investors identify trends and make informed decisions in the financial markets. It is a simple mathematical calculation that smooths out price data over a specified period of time, providing a clearer picture of the overall trend.
The formula for calculating the Moving Average is straightforward:
MA = Sum of Closing Prices / Number of Periods
Where:
- MA is the Moving Average
- Sum of Closing Prices is the total of the closing prices over the specified period
- Number of Periods is the number of time periods used in the calculation
For example, if you want to calculate a 10-day Moving Average, you would add up the closing prices of the last 10 days and divide the sum by 10.
The Moving Average formula can be applied to any type of financial data, such as stock prices, exchange rates, or commodity prices. It is commonly used in conjunction with other technical indicators to confirm trends, identify support and resistance levels, and generate buy or sell signals.
It is important to note that Moving Averages are lagging indicators, meaning they are based on past price data. They are not predictive in nature and should be used in conjunction with other technical analysis tools and fundamental analysis to make well-informed trading decisions.
Calculation Method
The calculation method for a moving average involves taking the average of a specified number of data points over a given time period. This is done by adding up the values of the data points and dividing the sum by the number of data points.
For example, if you want to calculate a 10-day moving average for a stock’s closing price, you would add up the closing prices for the past 10 days and divide the sum by 10. This would give you the value of the moving average for that day.
As each new day’s closing price is added to the calculation, the oldest day’s closing price is dropped from the calculation. This creates a moving average that constantly updates and reflects the most recent data.
The calculation method can be applied to different types of moving averages, such as simple moving averages (SMA) and exponential moving averages (EMA). The main difference between these two types is the weighting assigned to each data point. SMAs give equal weight to all data points, while EMAs give more weight to recent data points.
Moving averages are often used in technical analysis to identify trends and potential entry or exit points for trades. Traders and investors use moving averages to smooth out price fluctuations and identify the overall direction of a security’s price movement.
Types of Moving Averages
Simple Moving Average (SMA)
The Simple Moving Average (SMA) is the most basic type of moving average. It is calculated by taking the average price of an asset over a specified period of time. The SMA gives equal weight to each data point in the calculation, making it a simple and straightforward indicator.
Exponential Moving Average (EMA)
The Exponential Moving Average (EMA) is a more complex type of moving average that gives more weight to recent data points. This means that the EMA reacts faster to price changes compared to the SMA. Traders often use the EMA to identify short-term trends and to generate trading signals.
Weighted Moving Average (WMA)
The Weighted Moving Average (WMA) is another type of moving average that assigns different weights to each data point. The weights are determined by the trader or investor based on their analysis of the market. The WMA is useful for giving more importance to recent data points while still considering older data.
Smoothed Moving Average (SMMA)
The Smoothed Moving Average (SMMA) is a variation of the simple moving average that applies a smoothing technique to the calculation. This helps to reduce the impact of short-term price fluctuations and provides a smoother line on the chart. The SMMA is often used to identify long-term trends.
Adaptive Moving Average (AMA)
The Adaptive Moving Average (AMA) is a type of moving average that adjusts its sensitivity to price changes based on market conditions. It uses a combination of different moving averages and a volatility indicator to determine the optimal parameters for the calculation. The AMA is designed to adapt to changing market conditions and provide more accurate signals.
Conclusion
Each type of moving average has its own advantages and disadvantages, and traders may choose to use different types depending on their trading style and the market conditions. It is important to understand the characteristics of each moving average and how they can be applied in technical analysis to make informed trading decisions.
| Type | Calculation Method | Advantages |
|---|---|---|
| Simple Moving Average (SMA) | Sum of prices / Number of periods | Simple and straightforward |
| Exponential Moving Average (EMA) | React faster to price changes | |
| Weighted Moving Average (WMA) | (Price1 * Weight1) + (Price2 * Weight2) + … + (PriceN * WeightN) | Assign different weights to data points |
| Smoothed Moving Average (SMMA) | Reduce impact of short-term fluctuations | |
| Adaptive Moving Average (AMA) | Combination of different moving averages and a volatility indicator | Adjust sensitivity to price changes based on market conditions |

Emily Bibb simplifies finance through bestselling books and articles, bridging complex concepts for everyday understanding. Engaging audiences via social media, she shares insights for financial success. Active in seminars and philanthropy, Bibb aims to create a more financially informed society, driven by her passion for empowering others.