
Descriptive Statistics: Definition
Overview
Descriptive statistics can be used to describe a single variable or multiple variables in a dataset. It can provide information about the frequency, proportion, and distribution of the data, as well as any patterns or trends that may exist.
Types
There are several types of descriptive statistics that can be used depending on the nature of the data and the specific research question. Some common types include:
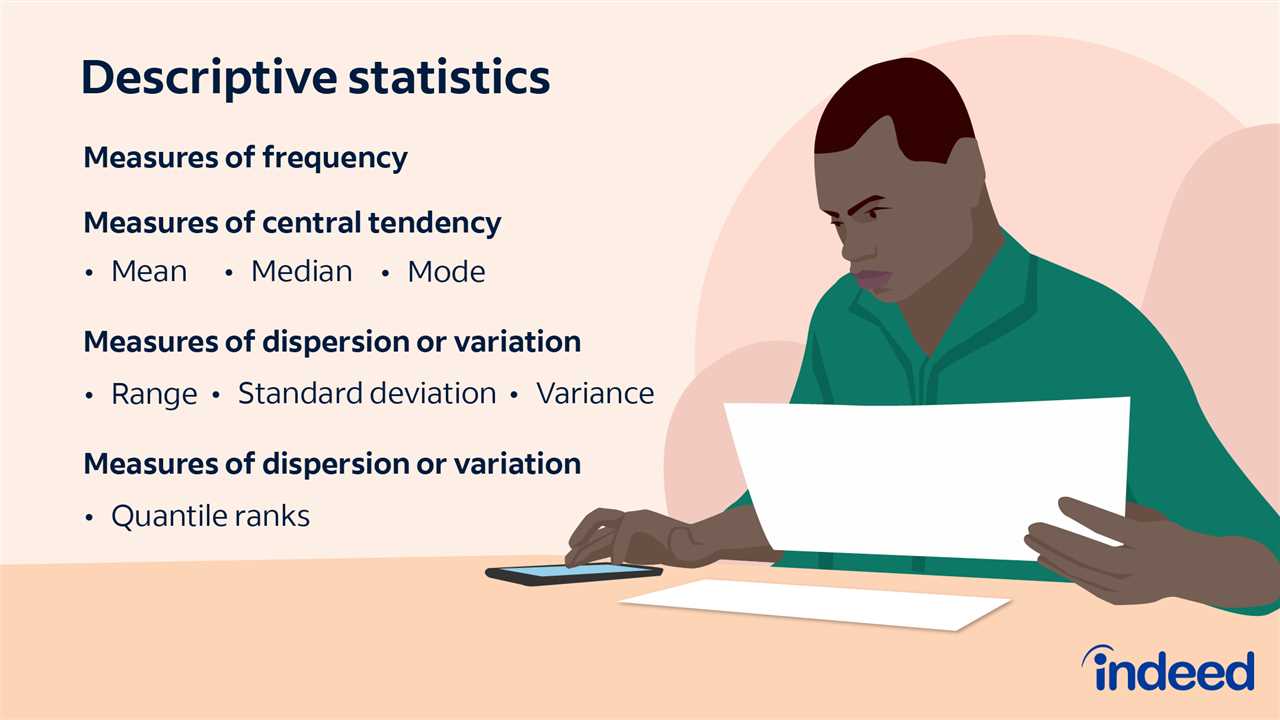
- Measures of central tendency: These include the mean, median, and mode, which provide information about the average or typical value of a variable.
- Measures of variability: These include the range, variance, and standard deviation, which provide information about the spread or dispersion of the data.
- Measures of shape: These include skewness and kurtosis, which provide information about the symmetry and peakedness of the data distribution.
- Measures of association: These include correlation and covariance, which provide information about the relationship between two or more variables.
Example
For example, let’s say we have a dataset of the heights of students in a class. We can use descriptive statistics to calculate the mean height, which will give us the average height of the students. We can also calculate the standard deviation, which will give us an idea of how much the heights vary from the mean.
Descriptive statistics can help us understand the distribution of heights, whether it is symmetric or skewed, and whether there are any outliers or unusual observations. This information can be useful in making comparisons, drawing conclusions, and making decisions based on the data.
What is Descriptive Statistics?
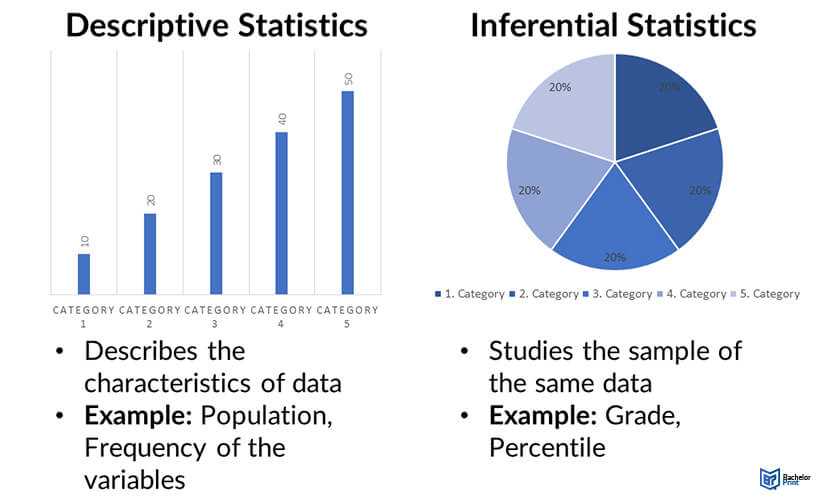
Descriptive statistics is a branch of statistics that focuses on summarizing and describing the main features of a dataset. It involves the use of various statistical measures and techniques to analyze and interpret data in a meaningful way. The goal of descriptive statistics is to provide a concise and informative summary of the data, allowing researchers and analysts to gain insights and make informed decisions.
Descriptive statistics play a crucial role in various fields, including finance, economics, psychology, sociology, and market research. In finance, for example, descriptive statistics are used to analyze stock prices, returns, and other financial indicators to understand market trends and make investment decisions. In psychology, descriptive statistics are used to summarize survey responses and measure psychological traits. In market research, descriptive statistics are used to analyze consumer preferences and behavior.
Overall, descriptive statistics provide a foundation for data analysis and interpretation. They help in organizing and summarizing large amounts of data, making it easier to identify patterns, trends, and relationships. By providing a clear and concise summary of the data, descriptive statistics enable researchers and analysts to communicate their findings effectively and draw meaningful conclusions.
Descriptive Statistics: Overview
Descriptive statistics is a branch of statistics that focuses on summarizing and describing the main characteristics of a dataset. It provides a way to organize, analyze, and interpret data in order to gain insights and make informed decisions.
What is Descriptive Statistics?
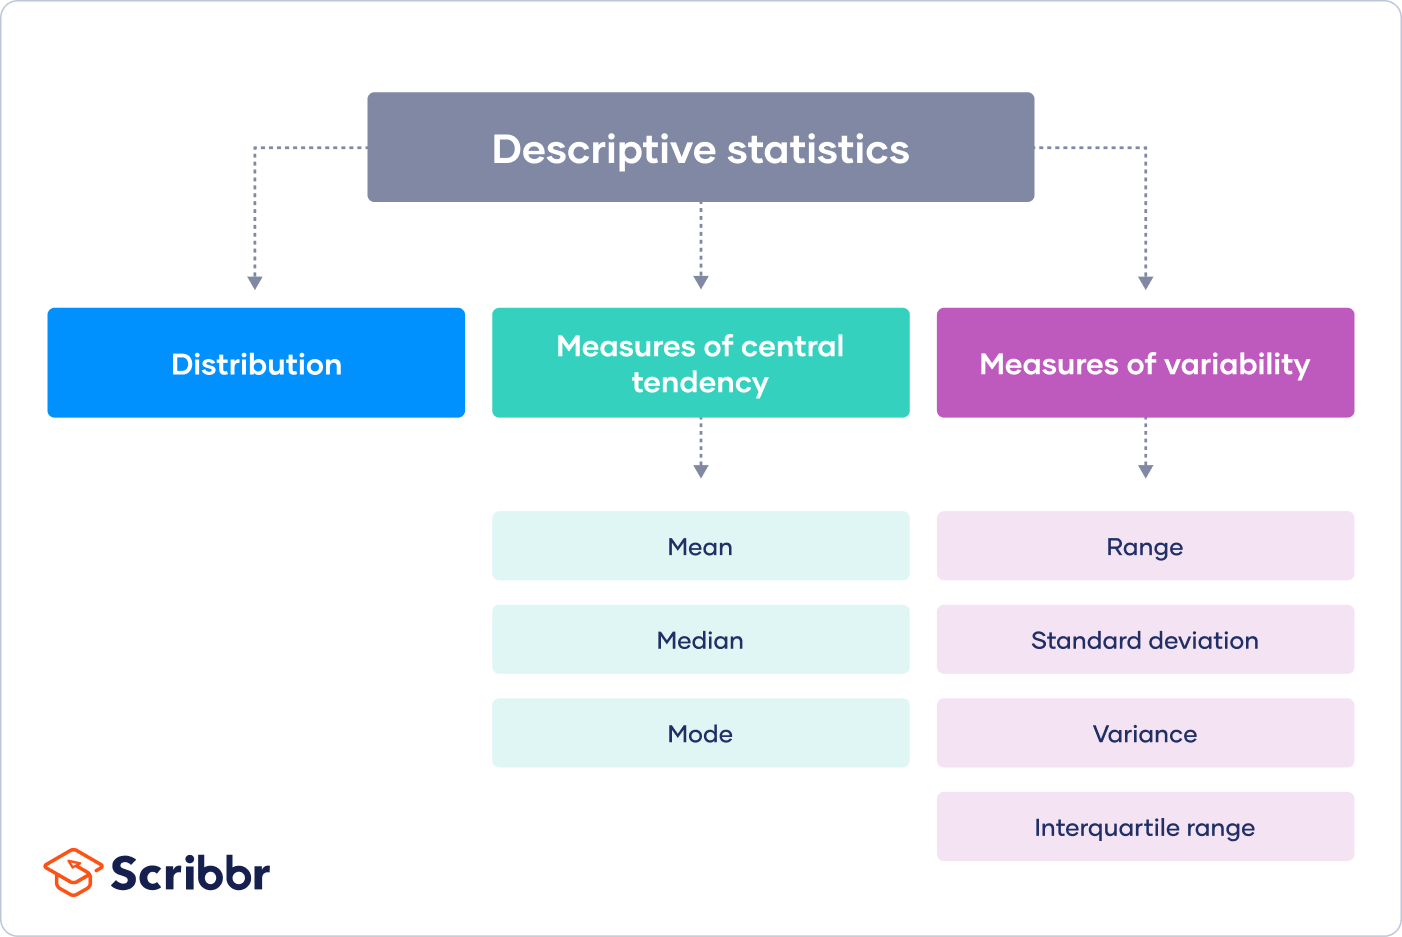
Descriptive statistics involves the use of various statistical measures to describe the central tendency, dispersion, and shape of a dataset. These measures include measures of central tendency such as mean, median, and mode, measures of dispersion such as range, variance, and standard deviation, and measures of shape such as skewness and kurtosis.
Descriptive statistics can be used to summarize both quantitative and qualitative data. For quantitative data, descriptive statistics provide information about the distribution of values, the spread of the data, and any outliers or extreme values. For qualitative data, descriptive statistics can provide information about the frequency and proportion of different categories or attributes.
Descriptive statistics play a crucial role in data analysis and research. They help researchers and analysts to understand the data they are working with and to communicate the main characteristics of the dataset to others. Descriptive statistics can be used to answer questions such as:
- What is the average income of a population?
- What is the range of test scores in a class?
- What is the most common type of car on the road?
By providing summary measures and visual representations, descriptive statistics enable researchers to identify patterns, trends, and relationships in the data. They also help in making comparisons between different groups or datasets, and in detecting any unusual or unexpected observations.
Common Types of Descriptive Statistics
There are several common types of descriptive statistics that are used to summarize and describe data:
- Measures of central tendency: These measures provide information about the center or average of a dataset. The most common measures of central tendency are the mean, median, and mode.
- Measures of dispersion: These measures provide information about the spread or variability of a dataset. The most common measures of dispersion are the range, variance, and standard deviation.
- Measures of shape: These measures provide information about the shape or distribution of a dataset. The most common measures of shape are skewness and kurtosis.
These measures can be calculated for both individual variables and for relationships between variables. They provide a concise summary of the data and help in making comparisons, identifying outliers, and detecting any patterns or trends.
Descriptive statistics is a branch of statistics that involves the collection, organization, analysis, interpretation, and presentation of data. It provides a summary of the main characteristics of a dataset, allowing researchers and analysts to gain insights and make informed decisions.
Descriptive statistics can be used to describe both quantitative and qualitative data. Quantitative data refers to numerical measurements, such as age, height, or income, while qualitative data refers to non-numerical observations, such as gender, occupation, or favorite color.
Importance of Descriptive Statistics
Descriptive statistics plays a crucial role in various fields, including finance, economics, psychology, sociology, and healthcare. It helps researchers and analysts understand the distribution, central tendency, and variability of data, which are essential for making accurate predictions and drawing meaningful conclusions.
By using descriptive statistics, researchers can summarize large amounts of data into manageable and interpretable forms. This allows them to identify patterns, trends, and outliers, as well as compare different groups or populations.
Common Measures in Descriptive Statistics
Descriptive statistics involves several measures that provide insights into the characteristics of a dataset. Some of the common measures include:
- Measures of central tendency: These measures, such as mean, median, and mode, represent the typical or average value of a dataset.
- Measures of dispersion: These measures, such as range, variance, and standard deviation, indicate the spread or variability of data points around the central tendency.
- Measures of shape: These measures, such as skewness and kurtosis, describe the asymmetry and peakedness of a distribution.
- Measures of association: These measures, such as correlation and covariance, quantify the relationship between two or more variables.
Data Visualization in Descriptive Statistics
In addition to numerical measures, descriptive statistics also involves data visualization techniques to present the findings in a visual and intuitive manner. Graphs, charts, histograms, and scatter plots are commonly used to display the distribution, patterns, and relationships within a dataset.
Descriptive Statistics: Types
In the field of statistics, descriptive statistics refers to the analysis and interpretation of data to provide a summary of its main characteristics. There are several types of descriptive statistics that are commonly used to describe and summarize data.
1. Measures of Central Tendency: These statistics are used to describe the center or average of a dataset. The most common measures of central tendency are the mean, median, and mode. The mean is calculated by summing all the values in the dataset and dividing by the number of values. The median is the middle value when the data is arranged in ascending or descending order. The mode is the value that appears most frequently in the dataset.
2. Measures of Dispersion: These statistics are used to describe the spread or variability of a dataset. The most common measures of dispersion are the range, variance, and standard deviation. The range is the difference between the maximum and minimum values in the dataset. The variance is the average of the squared differences between each value and the mean. The standard deviation is the square root of the variance.
3. Measures of Shape: These statistics are used to describe the shape or distribution of a dataset. The most common measures of shape are skewness and kurtosis. Skewness measures the asymmetry of the dataset, with positive skewness indicating a longer tail on the right side and negative skewness indicating a longer tail on the left side. Kurtosis measures the peakedness or flatness of the dataset, with positive kurtosis indicating a more peaked distribution and negative kurtosis indicating a flatter distribution.
4. Percentiles: Percentiles divide a dataset into equal parts based on their rank. For example, the 25th percentile is the value below which 25% of the data falls, and the 75th percentile is the value below which 75% of the data falls. Percentiles are often used to compare individual data points to the overall distribution of the dataset.
5. Correlation: Correlation measures the strength and direction of the linear relationship between two variables. It ranges from -1 to 1, with -1 indicating a perfect negative correlation, 0 indicating no correlation, and 1 indicating a perfect positive correlation. Correlation is often used to determine the relationship between variables and to make predictions based on this relationship.
6. Regression: Regression analysis is used to model the relationship between a dependent variable and one or more independent variables. It is often used to make predictions or to understand the impact of different variables on the dependent variable. Regression analysis can provide valuable insights into the relationships between variables and help in decision-making processes.
Common Types of Descriptive Statistics
Descriptive statistics is a branch of statistics that focuses on summarizing and describing the main characteristics of a dataset. There are several common types of descriptive statistics that are commonly used to analyze data:
- Measures of Central Tendency: These statistics provide information about the center or average of a dataset. The most commonly used measures of central tendency are the mean, median, and mode. The mean is calculated by summing all the values in the dataset and dividing by the number of values. The median is the middle value in a dataset when it is arranged in ascending or descending order. The mode is the value that appears most frequently in the dataset.
- Measures of Dispersion: These statistics provide information about the spread or variability of a dataset. The most commonly used measures of dispersion are the range, variance, and standard deviation. The range is the difference between the maximum and minimum values in a dataset. The variance is the average of the squared differences between each value and the mean. The standard deviation is the square root of the variance.
- Percentiles: Percentiles divide a dataset into 100 equal parts. They are often used to compare individual values to the rest of the dataset. For example, the 75th percentile represents the value below which 75% of the data falls.
- Skewness: Skewness measures the asymmetry of a dataset. A positive skewness indicates that the dataset has a longer tail on the right side, while a negative skewness indicates a longer tail on the left side. A skewness of zero indicates a symmetric distribution.
- Kurtosis: Kurtosis measures the shape of the distribution of a dataset. It indicates whether the dataset has heavy tails or a peaked distribution. Positive kurtosis indicates heavy tails, while negative kurtosis indicates light tails.
- Correlation: Correlation measures the relationship between two variables. It ranges from -1 to 1, where -1 indicates a perfect negative correlation, 1 indicates a perfect positive correlation, and 0 indicates no correlation.
- Regression: Regression analysis is used to model the relationship between a dependent variable and one or more independent variables. It helps to understand how changes in the independent variables affect the dependent variable.
Descriptive Statistics: Example
Example Scenario:
Suppose we have a dataset that contains information about the heights of a group of individuals. The dataset consists of the following measurements (in centimeters):
- 165
- 170
- 155
- 180
- 160
- 175
- 150
- 185
- 165
- 170
(165 + 170 + 155 + 180 + 160 + 175 + 150 + 185 + 165 + 170) / 10 = 166.5 cm
Arranging the heights in ascending order: 150, 155, 160, 165, 165, 170, 170, 175, 180, 185
The median height is the middle value, which is 165 cm.
Using the formula for standard deviation:
√(((165-166.5)² + (170-166.5)² + (155-166.5)² + (180-166.5)² + (160-166.5)² + (175-166.5)² + (150-166.5)² + (185-166.5)² + (165-166.5)² + (170-166.5)²) / 10) ≈ 9.78 cm
These are just a few examples of how descriptive statistics can be applied to analyze and summarize data. By using various statistical measures, we can gain valuable insights and make informed decisions based on the characteristics of the data.

Emily Bibb simplifies finance through bestselling books and articles, bridging complex concepts for everyday understanding. Engaging audiences via social media, she shares insights for financial success. Active in seminars and philanthropy, Bibb aims to create a more financially informed society, driven by her passion for empowering others.