
Double Top: Definition, Patterns, and Use in Trading
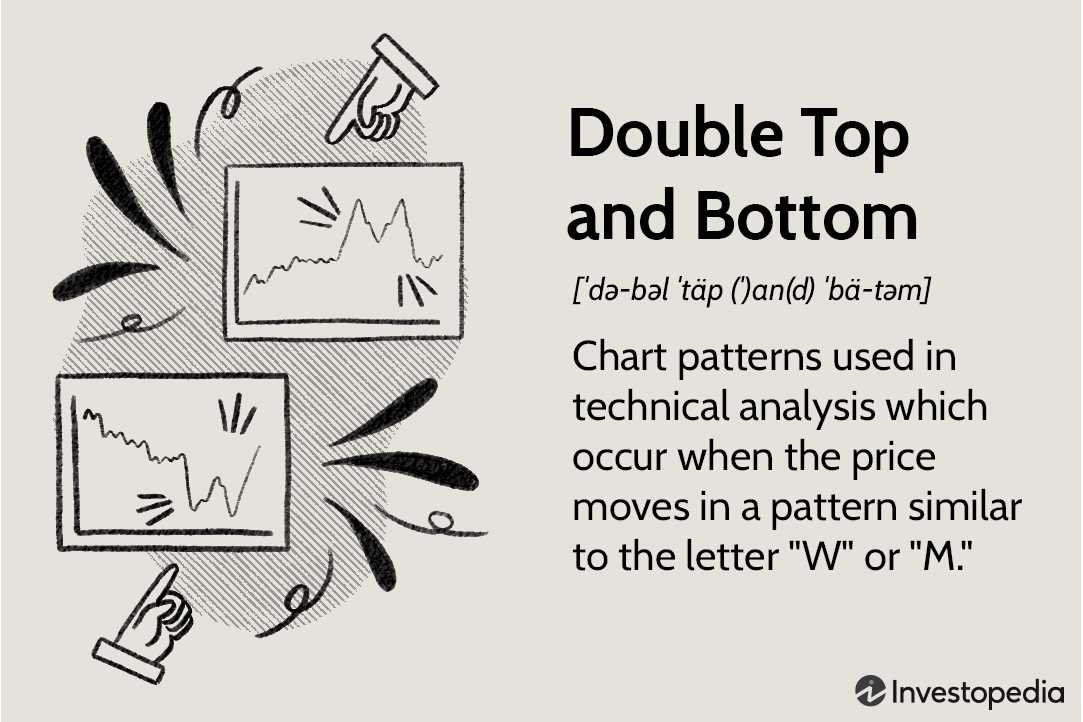
A double top is a technical chart pattern that signals a potential reversal in an uptrend. It is formed when the price of an asset reaches a high point, pulls back, and then rallies again to the same high level before reversing downward. The pattern resembles the letter “M” and is considered a bearish signal.
The double top pattern is typically used by traders to identify a potential selling opportunity. When the price reaches the second peak of the pattern and starts to decline, it suggests that the uptrend may be exhausted and a reversal is likely to occur. Traders often look for confirmation signals, such as a break below a support level, to confirm the validity of the pattern.
There are several key characteristics of a double top pattern that traders should be aware of. First, the two peaks should be relatively equal in height and occur within a reasonable timeframe. Second, the price should pull back between the two peaks, forming a trough or support level. Finally, the pattern is considered complete when the price breaks below the support level, confirming the reversal.
Definition of Double Top
A double top is a technical chart pattern that occurs in the financial markets, particularly in stock trading. It is formed when the price of an asset reaches a certain level, reverses, and then attempts to reach that level again, but fails. The pattern resembles the letter “M” and is considered a bearish reversal pattern.
Characteristics of a Double Top

There are several key characteristics that define a double top pattern:
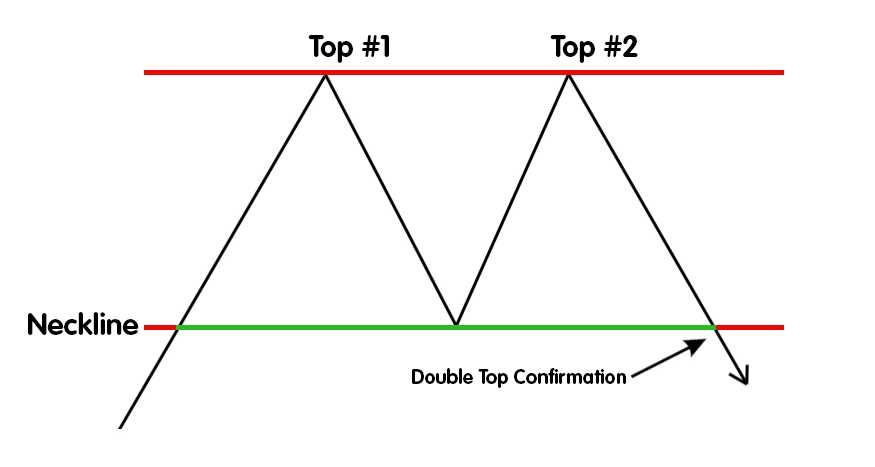
- Two Peaks: The pattern consists of two peaks that reach a similar price level. These peaks are separated by a trough, which represents a temporary decline in price.
- Neckline: The neckline is a horizontal line that connects the lows between the two peaks. It acts as a support level and plays a crucial role in confirming the pattern.
- Volume: Typically, the volume is higher during the first peak and lower during the second peak. This divergence in volume can indicate a lack of buying interest and potential weakness in the market.
- Breakout: The confirmation of a double top pattern occurs when the price breaks below the neckline. This breakout is often accompanied by an increase in volume, further validating the pattern.
Interpreting a Double Top Pattern
A double top pattern is considered a bearish signal, suggesting that the price of the asset is likely to decline. Traders often use this pattern as a signal to sell or take short positions. The pattern indicates that the buyers have failed to push the price higher, and the sellers are gaining control.
When the price breaks below the neckline, it confirms the pattern and provides a potential entry point for traders. They may choose to enter a short position or sell their existing holdings to capitalize on the expected downward movement.
It is important to note that not all double top patterns result in a significant decline in price. Traders should use additional technical analysis tools and indicators to confirm the pattern and assess the overall market conditions before making trading decisions.
| Advantages | Disadvantages |
|---|---|
| Provides a clear visual signal of a potential trend reversal | False breakouts can occur, leading to losses |
| Can be used in conjunction with other technical analysis tools for confirmation | Requires careful analysis and interpretation |
| Offers opportunities for short-selling or profit-taking | May not always result in a significant price decline |
Patterns of Double Top
A double top pattern is a technical analysis chart pattern that indicates a potential reversal in an uptrend. It is formed when the price of an asset reaches a high point, pulls back, and then rallies again to the same high point. This creates a resistance level that the price fails to break through, resulting in a downward reversal.
Traders often look for additional confirmation signals when identifying a double top pattern. These can include a decrease in trading volume during the formation of the second peak, as well as bearish candlestick patterns such as shooting stars or bearish engulfing patterns.
Key Characteristics of a Double Top Pattern:
- Two peaks: The pattern consists of two peaks, with a trough in between.
- Neckline: The trough between the two peaks forms a neckline, which acts as a support level.
- Resistance: The second peak fails to break through the resistance level created by the first peak.
- Confirmation: A break below the neckline confirms the pattern and signals a potential downward reversal.
When trading the double top pattern, traders often look for short-selling opportunities or take profit on long positions. They may place stop-loss orders above the second peak to limit potential losses if the price breaks through the resistance level.
It is important to note that the double top pattern is not always a reliable indicator of a reversal. Traders should use additional technical analysis tools and indicators to confirm the pattern and make informed trading decisions.
Use of Double Top in Trading
The double top pattern is a popular chart pattern used in technical analysis to identify potential trend reversals. Traders use this pattern to make informed decisions about when to enter or exit trades.
When a double top pattern forms, it indicates that the price of an asset has reached a resistance level twice and failed to break through. This can be a signal that the upward trend is losing momentum and a reversal may be imminent.
Traders can use the double top pattern to set up potential short trades. They may choose to enter a short position when the price breaks below the neckline, which is the support level formed by connecting the lows between the two peaks of the pattern. This break below the neckline confirms the pattern and suggests that the price is likely to continue moving lower.
Additionally, traders can use the double top pattern to set profit targets. They may choose to set their profit target at a level equal to the distance between the neckline and the highest peak of the pattern. This provides a potential target for the price to reach before reversing its downward movement.
It is important to note that the double top pattern is not always a reliable indicator of a trend reversal. Traders should use additional technical analysis tools and indicators to confirm the pattern and make informed trading decisions.

Emily Bibb simplifies finance through bestselling books and articles, bridging complex concepts for everyday understanding. Engaging audiences via social media, she shares insights for financial success. Active in seminars and philanthropy, Bibb aims to create a more financially informed society, driven by her passion for empowering others.