
Average True Range (ATR) Formula
The Average True Range (ATR) is a technical analysis indicator that measures market volatility. It was developed by J. Welles Wilder Jr. and introduced in his book “New Concepts in Technical Trading Systems” in 1978. The ATR is widely used by traders and investors to determine the potential risk and reward of a particular investment.
The formula to calculate the Average True Range is as follows:
| Date | High | Low | Close | True Range | ATR |
|---|---|---|---|---|---|
| Day 1 | High 1 | Low 1 | Close 1 | ATR 1 | |
| Day 2 | High 2 | Low 2 | Close 2 | ATR 2 | |
| Day 3 | High 3 | Low 3 | Close 3 | ATR 3 | |
| … | … | … | … | … | … |
| Day n | High n | Low n | Close n | ATR n |
To calculate the ATR, you need to first calculate the True Range for each day. The True Range is the greatest of the following three values: the difference between the current high and the current low, the difference between the previous close and the current high, and the difference between the previous close and the current low.
Once you have calculated the True Range for each day, you can then calculate the ATR by taking the average of the True Range values over a specified period. The most commonly used period is 14 days, but you can adjust it according to your trading strategy and time frame.
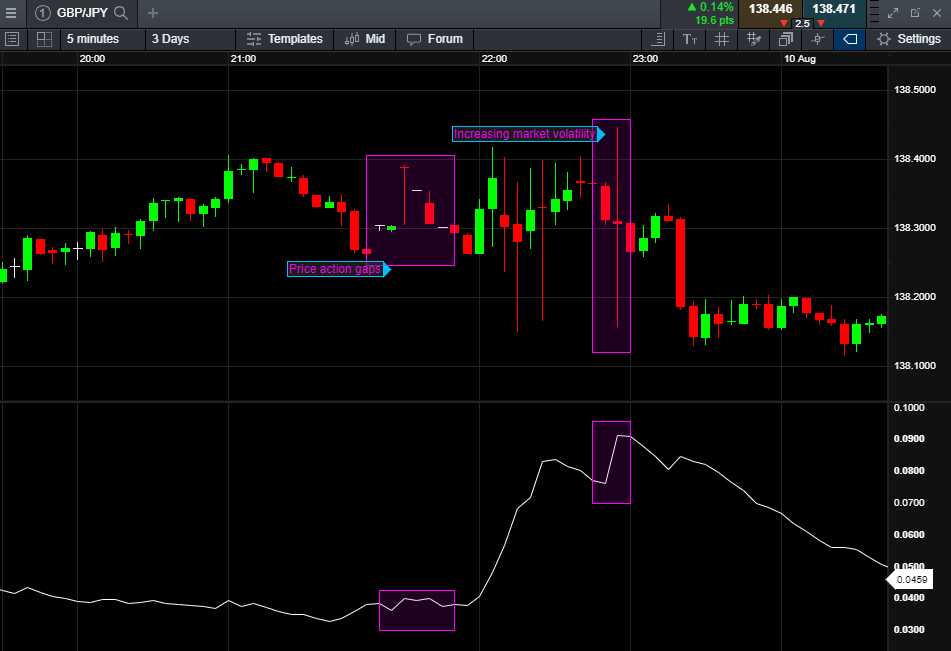
The ATR is usually displayed as a line chart or a histogram below the price chart. It can help traders identify potential breakouts, reversals, and trend strength. A higher ATR indicates higher volatility, while a lower ATR indicates lower volatility.
It is important to note that the ATR is not a directional indicator, meaning it does not provide information about the direction of the price movement. It only measures the magnitude of the price movement.
The Average True Range (ATR) is a technical indicator that measures market volatility. It was developed by J. Welles Wilder Jr. and introduced in his book “New Concepts in Technical Trading Systems” in 1978. The ATR is widely used by traders and investors to determine the potential price movement of an asset.
The ATR can be used in various ways to enhance trading strategies. Here are a few ways to utilize the ATR formula:
1. Volatility Measurement: The ATR provides a measure of market volatility, which can help traders identify periods of high or low volatility. High volatility indicates larger price swings and potential trading opportunities, while low volatility suggests a lack of price movement and potential consolidation.
2. Stop Loss Placement: The ATR can be used to determine appropriate stop loss levels. By multiplying the ATR value by a factor (such as 2 or 3), traders can set stop loss orders at a distance that takes into account the asset’s volatility. This helps protect against excessive losses in volatile markets.
3. Position Sizing: The ATR can also be used to determine the size of a position. Traders can adjust their position size based on the ATR value, taking into account the asset’s volatility. A larger ATR value may warrant a smaller position size to manage risk, while a smaller ATR value may allow for a larger position size.
4. Trend Confirmation: The ATR can be used to confirm the strength of a trend. Increasing ATR values indicate a strengthening trend, while decreasing ATR values suggest a weakening trend. Traders can use this information to make informed decisions about entering or exiting trades.
5. Range Expansion: The ATR can help identify potential range expansion. When the ATR value is low, it suggests that the market is in a period of consolidation or low volatility. Conversely, when the ATR value is high, it indicates that the market is experiencing increased volatility and potential range expansion. Traders can use this information to anticipate breakouts or reversals.

Emily Bibb simplifies finance through bestselling books and articles, bridging complex concepts for everyday understanding. Engaging audiences via social media, she shares insights for financial success. Active in seminars and philanthropy, Bibb aims to create a more financially informed society, driven by her passion for empowering others.