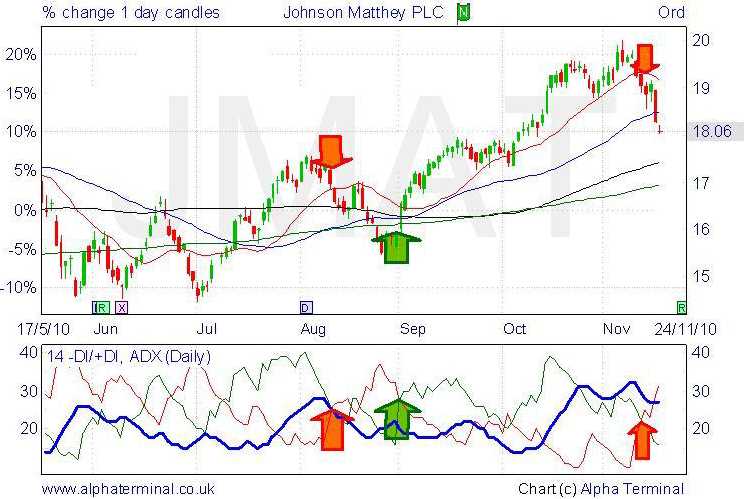
Functionality of Negative Directional Indicator -DI
The Negative Directional Indicator (-DI) is a technical analysis tool that is used to measure the strength of a downward trend in a financial market. It is part of the Average Directional Index (ADX) indicator, which was developed by J. Welles Wilder Jr. in the 1970s.
The -DI is calculated by comparing the current low with the previous low and the current high with the previous high. It measures the strength of the downward movement by comparing the difference between the two lows with the difference between the two highs. The -DI is then plotted on a chart as a line that oscillates between 0 and 100.
Interpretation of -DI

When the -DI line is above the 25 level, it indicates that there is a strong downward trend in the market. Traders can use this information to make informed decisions about entering or exiting a trade. For example, if the -DI line is above 25 and rising, it may be a good time to sell a security or take a short position.
On the other hand, when the -DI line is below the 25 level, it suggests that there is a weak downward trend or no downward trend at all. This may indicate that it is not a good time to sell a security or take a short position. Traders may want to wait for the -DI line to rise above 25 before making any trading decisions.
Utilizing -DI in Technical Analysis
The -DI can be used in conjunction with other technical analysis tools to confirm or validate trading signals. For example, if a trader sees a bearish candlestick pattern, such as a shooting star or a bearish engulfing pattern, and the -DI line is above 25, it may provide additional confirmation that a downward trend is likely to continue.
Traders can also use the -DI to identify potential trend reversals. If the -DI line has been above 25 for an extended period of time and then starts to decline, it may indicate that the downward trend is losing strength and a trend reversal is imminent. Traders can then look for other technical indicators or patterns to confirm the potential trend reversal.
Conclusion
Importance of Negative Directional Indicator -DI in Technical Analysis
The Negative Directional Indicator (-DI) is a key component in technical analysis and is used to identify the strength and direction of a downtrend in a financial instrument. It is part of the Average Directional Index (ADX) indicator, which was developed by J. Welles Wilder Jr. in the 1970s.
The -DI is calculated by comparing the current low price with the previous low price. If the current low price is lower than the previous low price, the -DI value is positive. If the current low price is higher than the previous low price, the -DI value is negative. The -DI is then smoothed over a specific period of time to provide a more accurate representation of the trend.
The -DI is important in technical analysis because it helps traders and investors identify potential downtrends in a financial instrument. By analyzing the -DI, traders can determine if a downtrend is gaining strength or weakening. This information can be used to make informed trading decisions, such as selling a stock or entering a short position.
In addition, the -DI can be used in conjunction with other technical indicators to confirm or validate trading signals. For example, if the -DI is showing a strong downtrend and the Relative Strength Index (RSI) is indicating an overbought condition, this could be a signal to sell a stock or enter a short position.
Furthermore, the -DI can be used to identify potential trend reversals. If the -DI has been showing a strong downtrend and then starts to flatten or turn upwards, this could be an early indication that the downtrend is losing strength and a trend reversal may be imminent. Traders can use this information to adjust their trading strategies accordingly.
Utilizing Negative Directional Indicator -DI for Trading Strategies
The Negative Directional Indicator (-DI) is a technical analysis tool that is used to identify the strength and direction of a downtrend in a financial instrument. It is a component of the Average Directional Index (ADX) indicator, which is a popular tool used by traders to determine the strength of a trend.
The -DI is calculated based on the difference between two consecutive lows and two consecutive highs. It measures the strength of the downward movement in the price of an asset. The -DI ranges from 0 to 100, with values above 25 indicating a strong downtrend and values below 25 indicating a weak downtrend.
Traders use the -DI to confirm the presence of a downtrend and to identify potential entry and exit points for their trades. When the -DI is above the positive directional indicator (+DI) and the ADX is above a certain threshold, it indicates a strong downtrend and traders may consider selling or shorting the asset.
Utilizing the -DI for Trading Strategies
There are several trading strategies that utilize the -DI to generate trading signals. One common strategy is the crossover strategy, where traders look for a crossover between the -DI and the +DI. When the -DI crosses above the +DI, it is considered a bearish signal, indicating a potential downtrend. Conversely, when the -DI crosses below the +DI, it is considered a bullish signal, indicating a potential uptrend.
It is important to note that the -DI should not be used in isolation and should be used in conjunction with other technical indicators and analysis tools. It is also important to consider the overall market conditions and the fundamentals of the asset before making any trading decisions.

Emily Bibb simplifies finance through bestselling books and articles, bridging complex concepts for everyday understanding. Engaging audiences via social media, she shares insights for financial success. Active in seminars and philanthropy, Bibb aims to create a more financially informed society, driven by her passion for empowering others.
