
Definition of Momentum in Trading
Momentum in trading refers to the rate at which the price of a financial instrument is changing. It is a technical indicator that measures the strength and speed of a price movement in a particular direction. Traders use momentum to identify potential buying or selling opportunities in the market.
Momentum is based on the principle that an object in motion tends to stay in motion. In the context of trading, this means that if a financial instrument is experiencing a strong upward or downward movement, it is likely to continue in that direction for a period of time before it starts to reverse.
Interpreting Momentum

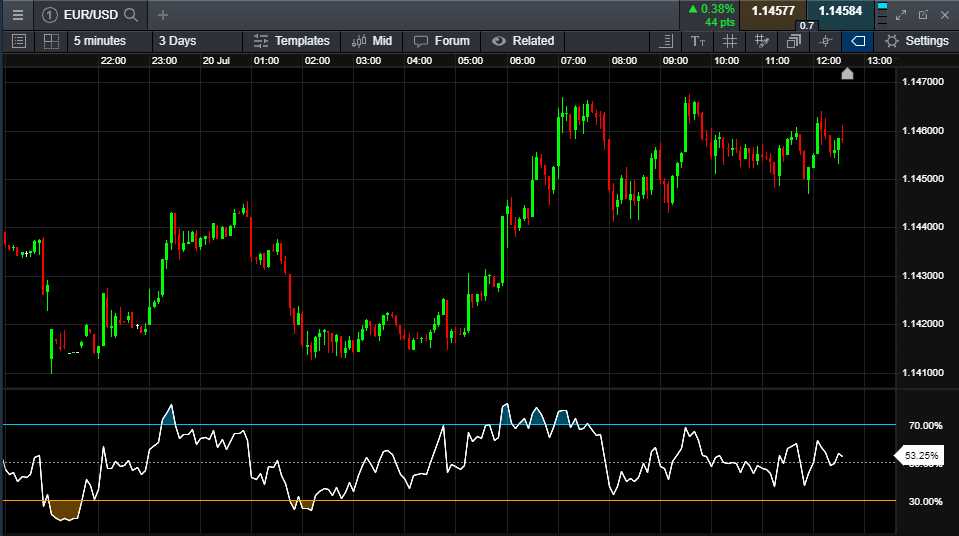
When analyzing momentum, traders look for two main signals: overbought and oversold conditions. An overbought condition occurs when the price has risen too quickly and is likely to reverse or experience a correction. Conversely, an oversold condition occurs when the price has fallen too quickly and is likely to rebound or experience a rally.
Traders can use momentum indicators to identify these conditions and make informed trading decisions. For example, if the RSI indicator shows that a stock is overbought, a trader may consider selling or shorting the stock. On the other hand, if the RSI indicator shows that a stock is oversold, a trader may consider buying or going long on the stock.
Limitations of Momentum
While momentum indicators can be useful tools for traders, they are not foolproof and should be used in conjunction with other technical and fundamental analysis. One limitation of momentum indicators is that they can give false signals during periods of low volatility or when the market is in a sideways trend.
Additionally, momentum indicators are lagging indicators, which means they are based on past price data and may not accurately predict future price movements. Traders should use caution when relying solely on momentum indicators and should consider other factors, such as trend analysis and market news, to confirm their trading decisions.
Tools for Analyzing Momentum

One of the most commonly used tools for analyzing momentum is the moving average. A moving average is a trend-following indicator that smooths out price data over a specified period of time. By calculating the average price over a given time frame, moving averages can help traders identify the direction and strength of a trend.
Another tool that traders can use to analyze momentum is the relative strength index (RSI). The RSI is a momentum oscillator that measures the speed and change of price movements. It ranges from 0 to 100 and is typically used to identify overbought and oversold conditions in the market. Traders can use the RSI to determine whether a market is overbought and due for a correction, or oversold and due for a rebound.
Bollinger Bands are another popular tool for analyzing momentum. Bollinger Bands consist of a middle band, which is a moving average, and an upper and lower band, which are standard deviations of the middle band. The width of the bands expands and contracts based on market volatility. Traders can use Bollinger Bands to identify periods of high and low volatility, which can indicate potential changes in momentum.
Volume analysis is also an important tool for analyzing momentum. By analyzing the volume of trades, traders can gain insights into the strength and conviction of market trends. High volume during an uptrend, for example, can indicate strong buying pressure and confirm the strength of the trend. Conversely, low volume during a downtrend can suggest weak selling pressure and signal a potential reversal.
Finally, trendlines can be a useful tool for analyzing momentum. Trendlines are lines drawn on a price chart to connect consecutive highs or lows. By drawing trendlines, traders can identify the direction and strength of a trend. Breakouts above or below trendlines can indicate a shift in momentum and provide trading opportunities.
How to Identify Momentum in Trading
Identifying momentum in trading is crucial for traders as it can provide valuable insights into potential market trends and opportunities. Here are some key steps to help you identify momentum in trading:
1. Use Technical Indicators
Technical indicators are mathematical calculations based on historical price and volume data that can help identify momentum in trading. Some commonly used technical indicators for momentum analysis include:
- Relative Strength Index (RSI): This indicator measures the speed and change of price movements and is used to identify overbought or oversold conditions.
- Moving Average Convergence Divergence (MACD): MACD is a trend-following momentum indicator that shows the relationship between two moving averages of a security’s price.
- Stochastic Oscillator: This indicator compares a security’s closing price to its price range over a specific period of time to determine its momentum.
2. Analyze Volume
Volume is an important factor in identifying momentum in trading. Increasing volume during price movements indicates strong momentum, while decreasing volume may suggest a weakening trend. Analyzing volume alongside price movements can provide confirmation of the momentum.
3. Look for Breakouts
Breakouts occur when the price of a security moves beyond a certain level of resistance or support. Breakouts can indicate a strong momentum shift in the market, as it suggests that buyers or sellers are gaining control. Traders often look for breakouts as potential entry points for trades.
4. Monitor Price Patterns
Price patterns can provide valuable insights into momentum in trading. Some common price patterns that indicate momentum include:
- Higher Highs and Higher Lows: This pattern indicates an uptrend and suggests strong buying pressure.
- Lower Highs and Lower Lows: This pattern indicates a downtrend and suggests strong selling pressure.
- Consolidation: Consolidation patterns indicate a period of indecision in the market and can precede a breakout or reversal.
5. Consider Timeframes
By following these steps and using a combination of technical indicators, volume analysis, price patterns, and timeframe analysis, you can effectively identify momentum in trading. Remember to always conduct thorough research and practice risk management when trading based on momentum.
Risks and Challenges of Trading with Momentum
Trading with momentum can be an effective strategy for capturing short-term price movements and generating profits. However, it also comes with its own set of risks and challenges that traders need to be aware of.
1. False Breakouts
One of the main risks of trading with momentum is the possibility of false breakouts. A false breakout occurs when a price breaks through a key level of support or resistance, only to quickly reverse and move in the opposite direction. This can lead to significant losses for traders who enter positions based on the momentum of the breakout.
To mitigate the risk of false breakouts, traders can use additional technical indicators or confirmatory signals to validate the momentum before entering a trade. These indicators can include volume analysis, trend lines, or moving averages.
2. Overbought and Oversold Conditions

Another challenge of trading with momentum is identifying overbought and oversold conditions. When a stock or asset becomes overbought, it means that it has experienced a significant price increase and may be due for a correction. Conversely, when an asset becomes oversold, it means that it has experienced a significant price decrease and may be due for a rebound.
3. Market Volatility
Momentum trading can be particularly challenging during periods of high market volatility. Volatility refers to the rapid and significant price fluctuations in the market, which can make it difficult to accurately predict and trade based on momentum.
During volatile market conditions, traders may experience increased slippage, where the execution price of a trade differs from the expected price, leading to potential losses. It is important for traders to be aware of market volatility and adjust their trading strategies accordingly, such as by using wider stop-loss orders or reducing position sizes.
4. Emotional Bias
Trading with momentum can also be challenging due to the emotional biases that can influence decision-making. When traders see a strong momentum in a particular direction, they may be tempted to chase the trade and enter positions without proper analysis or risk management.
To overcome emotional biases, traders should develop a disciplined trading plan and stick to it. This plan should include predetermined entry and exit points, as well as risk management strategies, to avoid making impulsive decisions based on short-term momentum.

Emily Bibb simplifies finance through bestselling books and articles, bridging complex concepts for everyday understanding. Engaging audiences via social media, she shares insights for financial success. Active in seminars and philanthropy, Bibb aims to create a more financially informed society, driven by her passion for empowering others.