
Definition of Ultimate Oscillator
The Ultimate Oscillator is a technical analysis tool that is used to measure momentum and identify overbought or oversold conditions in a security. It was developed by Larry Williams and first introduced in 1976. The oscillator is designed to provide a more accurate representation of price action by taking into account three different timeframes.
The Ultimate Oscillator combines the concepts of short-term, intermediate-term, and long-term momentum to generate a single value that ranges from 0 to 100. A reading above 70 is considered overbought, indicating that the security may be due for a price correction. Conversely, a reading below 30 is considered oversold, suggesting that the security may be due for a price rebound.
The formula for calculating the Ultimate Oscillator involves several steps. First, the True Range is calculated for each period, which measures the difference between the current high and low prices. Next, the Buying Pressure and Selling Pressure are calculated for each period, based on the relationship between the current close and the previous close. Finally, the Ultimate Oscillator is calculated by taking a weighted average of the Buying Pressure and Selling Pressure for each of the three timeframes.
Traders and investors use the Ultimate Oscillator to generate buy and sell signals. When the oscillator crosses above the overbought threshold of 70, it is considered a sell signal. Conversely, when the oscillator crosses below the oversold threshold of 30, it is considered a buy signal. Additionally, divergences between the oscillator and the price can also provide valuable insights into potential trend reversals.
It is important to note that the Ultimate Oscillator is just one tool among many in a trader’s toolkit. It should be used in conjunction with other technical indicators and analysis methods to confirm signals and make informed trading decisions. As with any technical analysis tool, it is also important to consider the limitations and potential drawbacks of the Ultimate Oscillator.
Formula of Ultimate Oscillator
The Ultimate Oscillator is a technical analysis indicator that combines multiple timeframes and calculates a weighted average of three different oscillators. The formula for calculating the Ultimate Oscillator is as follows:
Step 1: Calculate Buying Pressure (BP)
Buying Pressure (BP) is the difference between the current closing price and the lowest price of the current period. If the closing price is higher than the lowest price, BP is zero.
Step 2: Calculate True Range (TR)
True Range (TR) is the greatest of the following three values:
Step 3: Calculate Average True Range (ATR)
Average True Range (ATR) is the average of the True Range values over a specified period. It is typically calculated using a simple moving average.
ATR = Sum of TR values / Number of periods
Step 4: Calculate Buying Pressure (BP) Sum
Calculate the sum of the Buying Pressure values over a specified period.
BP Sum = Sum of BP values over a specified period
Step 5: Calculate True Range (TR) Sum
Calculate the sum of the True Range values over a specified period.
TR Sum = Sum of TR values over a specified period
Step 6: Calculate Average Buying Pressure (ABP)
Calculate the average Buying Pressure over a specified period.
ABP = BP Sum / TR Sum
Step 7: Calculate Ultimate Oscillator (UO)
The Ultimate Oscillator is calculated using the following formula:
UO = 100 x [(4 x ABP1) + (2 x ABP2) + ABP3] / (4 + 2 + 1)
Where ABP1, ABP2, and ABP3 are the average Buying Pressure values over three different periods.
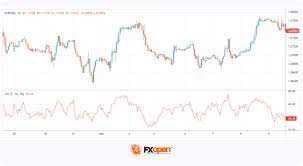
The Ultimate Oscillator is typically displayed as a line chart that fluctuates between 0 and 100. Traders use the indicator to identify overbought and oversold conditions in the market, as well as potential trend reversals.
Strategies for Using Ultimate Oscillator
The Ultimate Oscillator is a versatile technical analysis tool that can be used in various trading strategies. Here are some strategies for effectively using the Ultimate Oscillator:
1. Overbought and Oversold Levels
One way to use the Ultimate Oscillator is to identify overbought and oversold levels. When the oscillator rises above 70, it indicates that the market is overbought, and a reversal or correction may be imminent. Conversely, when the oscillator falls below 30, it suggests that the market is oversold, and a potential buying opportunity may arise.
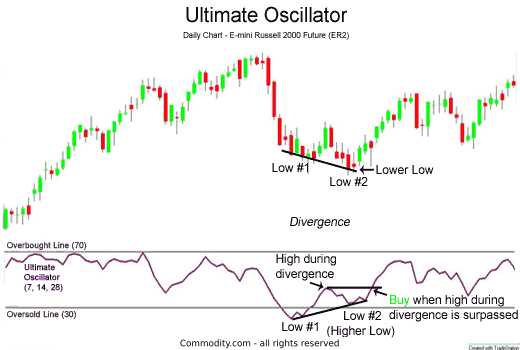
2. Divergence
Divergence occurs when the price of an asset moves in the opposite direction of the Ultimate Oscillator. This can be a powerful signal of a potential trend reversal. For example, if the price of an asset is making higher highs, but the Ultimate Oscillator is making lower highs, it could indicate that the bullish momentum is weakening, and a bearish reversal may occur.
3. Trend Confirmation
The Ultimate Oscillator can also be used to confirm the direction of a trend. If the oscillator is consistently making higher highs and higher lows during an uptrend, it suggests that the bullish momentum is strong and the trend is likely to continue. Conversely, if the oscillator is consistently making lower highs and lower lows during a downtrend, it indicates that the bearish momentum is strong and the trend is likely to persist.
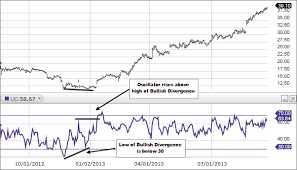
4. Bullish and Bearish Divergence
Bullish divergence occurs when the price of an asset is making lower lows, but the Ultimate Oscillator is making higher lows. This can be a signal of a potential bullish reversal. On the other hand, bearish divergence occurs when the price is making higher highs, but the oscillator is making lower highs. This can be a signal of a potential bearish reversal.
5. Moving Average Crossovers
Another strategy for using the Ultimate Oscillator is to combine it with moving average crossovers. When the oscillator crosses above a short-term moving average, it can be a signal to buy. Conversely, when the oscillator crosses below a short-term moving average, it can be a signal to sell.

Emily Bibb simplifies finance through bestselling books and articles, bridging complex concepts for everyday understanding. Engaging audiences via social media, she shares insights for financial success. Active in seminars and philanthropy, Bibb aims to create a more financially informed society, driven by her passion for empowering others.