
Tenkan-Sen Conversion Line Formula Calculation and Meaning

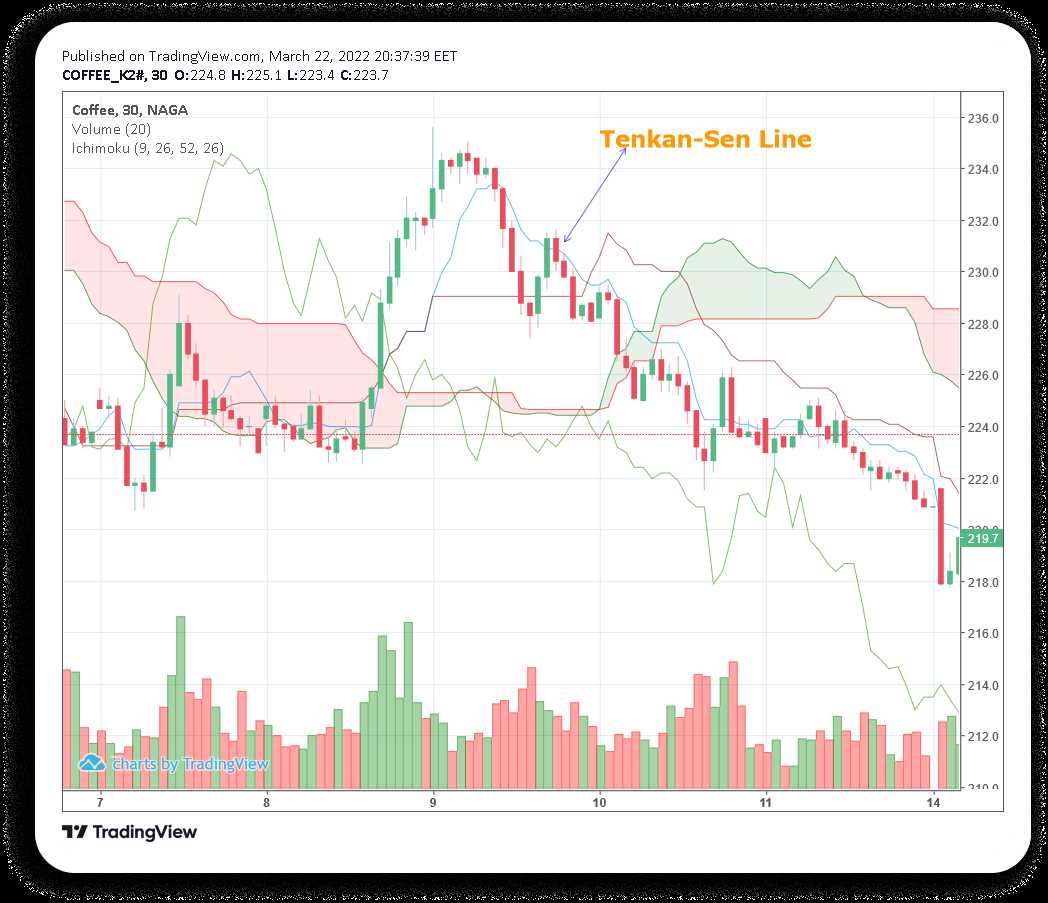
The Tenkan-Sen Conversion Line is a key component of the Ichimoku Kinko Hyo technical analysis system. It is used to identify short-term trends and potential reversal points in the market.
The formula for calculating the Tenkan-Sen Conversion Line is quite simple. It is the average of the highest high and the lowest low over a specific period of time. Typically, this period is set to 9 periods, but it can be adjusted based on the trader’s preference and the time frame being analyzed.
To calculate the Tenkan-Sen Conversion Line, you first need to identify the highest high and the lowest low over the specified period. Once you have these values, you add them together and divide by 2 to find the average. This average is then plotted on the chart as a line.
Traders also pay attention to the slope of the Tenkan-Sen Conversion Line. If the line is steeply rising or falling, it suggests that the trend is strong. On the other hand, if the line is flat or moving sideways, it suggests that the market is ranging or consolidating.
It is important to note that the Tenkan-Sen Conversion Line is a short-term indicator and should not be used in isolation. It is best used in conjunction with other technical analysis tools and indicators to confirm trading signals and make informed trading decisions.
The Tenkan-Sen Conversion Line is calculated by taking the highest high and the lowest low over a specific period and dividing it by two. This period is typically set to 9, but it can be adjusted to suit the trader’s preferences and the time frame being analyzed. The resulting value is plotted on the chart as a line that moves with the price action.
In addition to its role in trend analysis, the Tenkan-Sen Conversion Line can also act as a support or resistance level. When the price approaches the Tenkan-Sen Conversion Line from below, it may find support and bounce back up. Conversely, when the price approaches the line from above, it may encounter resistance and reverse its direction.
It is important to note that the Tenkan-Sen Conversion Line is just one component of the Ichimoku Kinko Hyo system, and it should be used in conjunction with other indicators and analysis techniques for a comprehensive view of the market. Traders should also consider the overall market conditions, news events, and other factors that may impact the price action.
Calculating the Tenkan-Sen Conversion Line
The Tenkan-Sen Conversion Line is a key component of the Ichimoku Kinko Hyo technical analysis indicator. It is used to identify short-term trend reversals and potential entry points in the market. Calculating the Tenkan-Sen Conversion Line involves a simple mathematical formula.
Formula
The formula for calculating the Tenkan-Sen Conversion Line is as follows:
- Find the highest high and lowest low over the past 9 periods.
- Add the highest high and lowest low together.
- Divide the sum by 2 to get the average.
Mathematically, the formula can be represented as:
Tenkan-Sen = (Highest High + Lowest Low) / 2
Example Calculation
Let’s say we have the following data for the past 9 periods:
- Highest High: 50
- Lowest Low: 40
Using the formula, we can calculate the Tenkan-Sen Conversion Line:
Tenkan-Sen = (50 + 40) / 2 = 45
Therefore, the Tenkan-Sen Conversion Line for this example is 45.
Interpreting the Tenkan-Sen Conversion Line
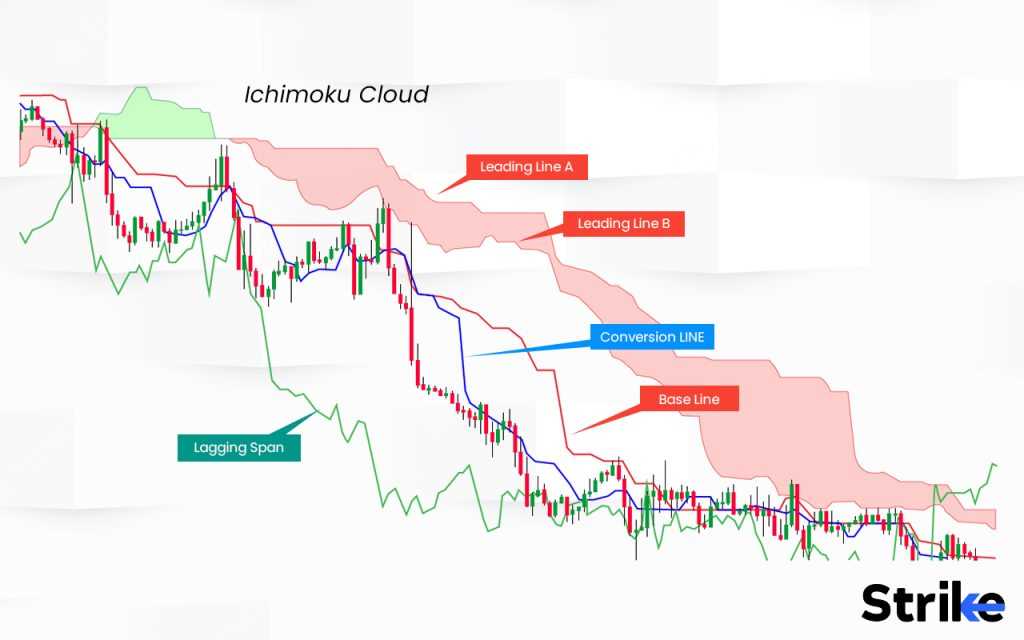
The Tenkan-Sen Conversion Line is often used in conjunction with other components of the Ichimoku Kinko Hyo indicator to analyze market trends. When the Tenkan-Sen is above the Kijun-Sen (another component of the indicator), it indicates a bullish trend. Conversely, when the Tenkan-Sen is below the Kijun-Sen, it suggests a bearish trend.
Traders can also look for crossovers between the Tenkan-Sen and the Kijun-Sen as potential entry or exit signals. For example, a bullish crossover occurs when the Tenkan-Sen crosses above the Kijun-Sen, indicating a possible buying opportunity. On the other hand, a bearish crossover happens when the Tenkan-Sen crosses below the Kijun-Sen, signaling a potential selling opportunity.
Overall, the Tenkan-Sen Conversion Line is a valuable tool for technical analysts to identify short-term trend reversals and make informed trading decisions.
Interpreting the Meaning of the Tenkan-Sen Conversion Line
The Tenkan-Sen Conversion Line is a key component of the Ichimoku Kinko Hyo technical analysis indicator. It is used to identify short-term trend reversals and provide signals for potential entry and exit points in the market.
When the Tenkan-Sen Conversion Line crosses above the Kijun-Sen Base Line, it is considered a bullish signal. This indicates that the short-term trend is shifting upwards and there may be buying opportunities in the market. Traders may look to enter long positions or add to existing positions in anticipation of further price appreciation.
Conversely, when the Tenkan-Sen Conversion Line crosses below the Kijun-Sen Base Line, it is considered a bearish signal. This indicates that the short-term trend is shifting downwards and there may be selling opportunities in the market. Traders may look to enter short positions or reduce existing positions to protect against potential losses.
It is important to note that the Tenkan-Sen Conversion Line is a short-term indicator and should be used in conjunction with other technical analysis tools and indicators to confirm signals and make informed trading decisions. Traders should also consider the overall trend and market conditions before placing trades based solely on the Tenkan-Sen Conversion Line.
Key Points to Remember:
- The Tenkan-Sen Conversion Line is a component of the Ichimoku Kinko Hyo indicator.
- When the Tenkan-Sen crosses above the Kijun-Sen, it is a bullish signal.
- When the Tenkan-Sen crosses below the Kijun-Sen, it is a bearish signal.
- Use the Tenkan-Sen in conjunction with other indicators and consider overall market conditions.

Emily Bibb simplifies finance through bestselling books and articles, bridging complex concepts for everyday understanding. Engaging audiences via social media, she shares insights for financial success. Active in seminars and philanthropy, Bibb aims to create a more financially informed society, driven by her passion for empowering others.