
Kijun-Sen Base Line Overview
The Kijun-Sen Base Line is a technical indicator used in technical analysis to identify potential support and resistance levels in the price of an asset. It is a component of the Ichimoku Kinko Hyo system, a popular Japanese charting technique.
What is the Kijun-Sen Base Line?
The Kijun-Sen Base Line is calculated by taking the average of the highest high and the lowest low over a specific period of time. It is typically calculated using a 26-period time frame, but can be adjusted based on the trader’s preference and the time frame being analyzed.
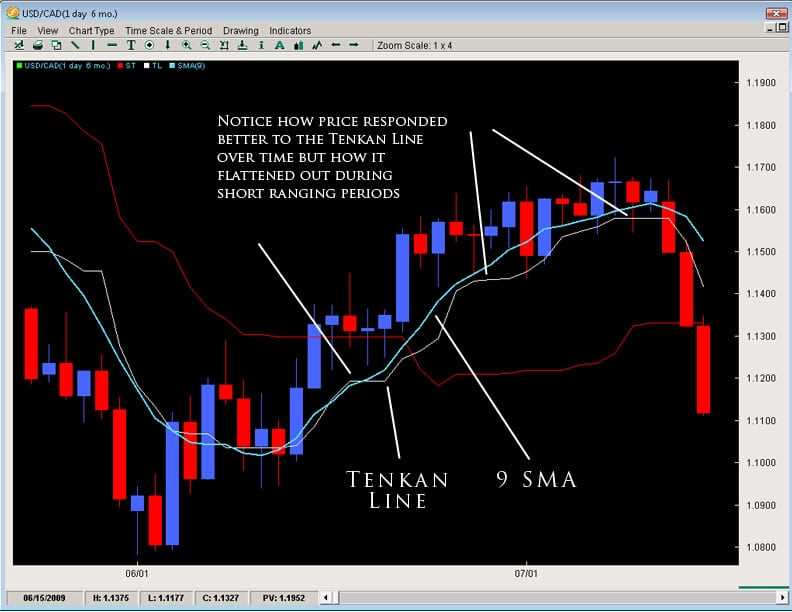
The Kijun-Sen Base Line is often used as a trend confirmation tool. When the price of an asset is above the Kijun-Sen Base Line, it is considered to be in an uptrend. Conversely, when the price is below the Kijun-Sen Base Line, it is considered to be in a downtrend.
How is the Kijun-Sen Base Line calculated?

The formula for calculating the Kijun-Sen Base Line is as follows:
Kijun-Sen Base Line = (Highest High + Lowest Low) / 2
Where:
- Highest High is the highest high over the specified period
- Lowest Low is the lowest low over the specified period
By taking the average of the highest high and the lowest low, the Kijun-Sen Base Line provides a smoothed line that represents the middle point of the price range over the specified period. This can help traders identify potential support and resistance levels.
It is important to note that the Kijun-Sen Base Line is a lagging indicator, meaning it is based on past price data. As a result, it may not always accurately reflect current market conditions. Traders often use it in conjunction with other technical indicators to confirm signals and make more informed trading decisions.
Formulas for Kijun-Sen Base Line Calculation

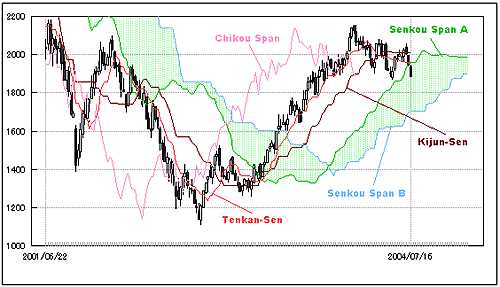
The Kijun-Sen Base Line is a key component of the Ichimoku Kinko Hyo technical analysis indicator. It is used to identify potential support and resistance levels in the market. The Kijun-Sen Base Line is calculated using the following formulas:
- Kijun-Sen Base Line (26-period) = (Highest High + Lowest Low) / 2 for the past 26 periods
The Kijun-Sen Base Line is a moving average line that helps traders identify the overall trend of the market. It is often used in conjunction with other Ichimoku components to confirm trading signals and determine entry and exit points.
To calculate the Kijun-Sen Base Line, you need to gather the highest high and lowest low prices for the past 26 periods. The highest high represents the highest price reached during the specified period, while the lowest low represents the lowest price reached. Once you have these values, you can use the formula mentioned above to calculate the Kijun-Sen Base Line.
By plotting the Kijun-Sen Base Line on a price chart, traders can visually analyze the market and identify potential areas of support and resistance. When the price is above the Kijun-Sen Base Line, it indicates a bullish trend, while a price below the line suggests a bearish trend.
Traders can also use the Kijun-Sen Base Line to generate trading signals. For example, when the price crosses above the Kijun-Sen Base Line, it may signal a buy opportunity, while a cross below the line may indicate a sell opportunity.
It is important to note that the Kijun-Sen Base Line is a lagging indicator, meaning it may not provide timely signals in fast-moving markets. Therefore, it is often used in combination with other technical analysis tools to confirm trading decisions.
Calculating Kijun-Sen Base Line
The Kijun-Sen Base Line is an important component of technical analysis, used to identify potential support and resistance levels in the market. It is calculated using a specific formula that takes into account the highest high and lowest low over a certain period of time.
To calculate the Kijun-Sen Base Line, follow these steps:
- First, determine the highest high and lowest low over a specific period of time. This period is typically set to 26 periods, but it can be adjusted based on the trader’s preference.
- Next, add the highest high and lowest low together and divide the sum by 2. This will give you the midpoint.
- Repeat this calculation for each period, updating the highest high and lowest low as new data becomes available.
- Finally, plot the calculated values on a chart to visualize the Kijun-Sen Base Line.
The Kijun-Sen Base Line is often used in conjunction with other technical indicators to confirm trading signals and determine potential entry and exit points. Traders typically look for price action to cross above or below the Kijun-Sen Base Line as a signal of a potential trend reversal or continuation.
It is important to note that the Kijun-Sen Base Line is a lagging indicator, meaning it may not always provide timely signals. Therefore, it is recommended to use it in combination with other technical analysis tools for a more comprehensive market analysis.
Technical Analysis Basic Education on Kijun-Sen Base Line
To calculate the Kijun-Sen Base Line, follow these steps:
- Identify the highest high and the lowest low over a specific period.
- Add the highest high and the lowest low together.
- Divide the sum by two.
Once the Kijun-Sen Base Line is calculated, it can be used in various ways to analyze price trends and make trading decisions. Here are a few key points to keep in mind:
- When the price is above the Kijun-Sen Base Line, it is considered bullish, indicating a potential uptrend.
- When the price is below the Kijun-Sen Base Line, it is considered bearish, indicating a potential downtrend.
- The Kijun-Sen Base Line can act as a support or resistance level, where price may bounce off or reverse direction.
- Traders often use the Kijun-Sen Base Line in conjunction with other technical analysis tools to confirm signals and make more informed trading decisions.

Emily Bibb simplifies finance through bestselling books and articles, bridging complex concepts for everyday understanding. Engaging audiences via social media, she shares insights for financial success. Active in seminars and philanthropy, Bibb aims to create a more financially informed society, driven by her passion for empowering others.