
What is Sample Distribution?
Sample distribution refers to the distribution of a particular variable within a sample. In statistics, a sample is a subset of a population that is used to make inferences or draw conclusions about the entire population. The sample distribution provides information about the variability and characteristics of the variable of interest within the sample.
Definition and Explanation
The sample distribution is a probability distribution that represents the possible values of a variable within a sample. It provides information about the likelihood of different values occurring within the sample. The shape of the sample distribution can vary depending on the characteristics of the variable being studied and the size of the sample.
How is Sample Distribution Used?
Sample distribution is also important in determining the accuracy and reliability of statistical results. It allows researchers to assess the variability of the variable within the sample and evaluate the precision of their estimates.
Applications and Importance
Sample distribution is widely used in various fields, including social sciences, economics, medicine, and market research. It plays a crucial role in hypothesis testing, where researchers compare the characteristics of a sample to a known population or another sample.
Moreover, sample distribution allows researchers to assess the representativeness of the sample and identify any biases or limitations in the data collection process. This information is crucial for ensuring the validity and generalizability of the research findings.
Example of Sample Distribution
To illustrate the concept of sample distribution, let’s consider a study that aims to determine the average height of adult males in a particular country. Instead of measuring the height of every adult male in the country, the researchers collect data from a sample of 500 adult males.
The sample distribution of heights would provide information about the range of heights observed within the sample, the average height, and the variability of heights. This information can then be used to make inferences about the average height of all adult males in the country.
By analyzing the sample distribution, researchers can estimate the population mean height, calculate the confidence interval, and determine the likelihood of different height values occurring within the population.
| Sample Height | Frequency |
|---|---|
| 160 cm | 10 |
| 165 cm | 20 |
| 170 cm | 50 |
| 175 cm | 100 |
| 180 cm | 150 |
| 185 cm | 100 |
| 190 cm | 50 |
| 195 cm | 20 |
| 200 cm | 10 |
Definition and Explanation
The sample distribution is derived by repeatedly sampling from the population and calculating the statistic of interest for each sample. This process allows us to understand the range of values that the statistic can take and the likelihood of observing certain values.
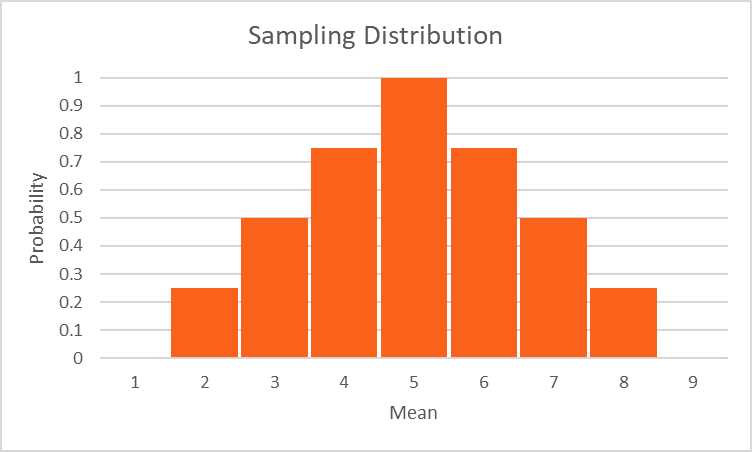
For example, let’s consider a population of students and their test scores. If we take multiple random samples from this population and calculate the mean test score for each sample, we can create a sample distribution of the means. This distribution will show us the range of possible mean scores and the probability of observing different values.
Central Limit Theorem
The concept of sample distribution is closely related to the Central Limit Theorem (CLT). The CLT states that for a large enough sample size, the distribution of the sample mean will be approximately normal, regardless of the shape of the population distribution. This is true even if the population distribution is not normally distributed.
The Central Limit Theorem is a fundamental principle in statistics and is widely used in hypothesis testing, confidence intervals, and other statistical analyses. It allows us to make reliable inferences about the population based on the sample distribution.
- Sample distribution refers to the distribution of a statistic calculated from multiple samples taken from a population.
- It provides insight into the variability of the statistic across different samples and helps in making inferences about the population.
- The sample distribution is derived by repeatedly sampling from the population and calculating the statistic of interest for each sample.
- The Central Limit Theorem states that for a large enough sample size, the distribution of the sample mean will be approximately normal, regardless of the shape of the population distribution.
- The Central Limit Theorem is widely used in hypothesis testing, confidence intervals, and other statistical analyses.
How is Sample Distribution Used?
Estimating Population Parameters
One of the main uses of sample distribution is to estimate population parameters. When it is not feasible or practical to collect data from an entire population, a sample is taken instead. By analyzing the characteristics of the sample, we can make inferences about the population as a whole.
For example, let’s say we want to estimate the average height of all adults in a country. It would be impractical to measure the height of every single adult, so we take a random sample of individuals and measure their heights. By analyzing the sample distribution of heights, we can estimate the average height of the entire population.
Hypothesis Testing
Another important use of sample distribution is in hypothesis testing. Hypothesis testing is a statistical method used to make decisions or draw conclusions about a population based on sample data.
When conducting a hypothesis test, we compare the characteristics of a sample to what we would expect to see if a certain hypothesis about the population were true. By analyzing the sample distribution, we can determine the likelihood of observing the sample results if the null hypothesis is true.
For example, let’s say we have a hypothesis that a new drug is effective in reducing blood pressure. We would take a sample of individuals with high blood pressure and measure their blood pressure before and after taking the drug. By analyzing the sample distribution of blood pressure changes, we can determine if the observed changes are statistically significant and provide evidence for or against the effectiveness of the drug.
Assessing Variability
Sample distribution is also used to assess the variability of a population. Variability refers to the spread or dispersion of data points in a population. By analyzing the sample distribution, we can estimate the variability of the population.
For example, let’s say we want to estimate the variability of test scores in a school district. We would take a random sample of students and collect their test scores. By analyzing the sample distribution of test scores, we can estimate the standard deviation or range of scores in the entire school district.
Applications and Importance
1. Statistical Inference
Sample distribution plays a fundamental role in statistical inference, which involves making predictions or drawing conclusions about a population based on a sample. By analyzing the sample distribution, statisticians can estimate population parameters and assess the uncertainty associated with these estimates.
2. Hypothesis Testing
Sample distribution is also essential in hypothesis testing, which is a statistical method used to assess the validity of a claim or hypothesis about a population. In hypothesis testing, the sample distribution is compared to a theoretical distribution to determine the likelihood of observing the sample data under the null hypothesis.
For instance, suppose a pharmaceutical company develops a new drug and wants to test its effectiveness. The company collects a sample of patients and randomly assigns them to either the treatment group (receiving the new drug) or the control group (receiving a placebo). By comparing the sample distribution of outcomes between the two groups, the company can determine if the drug has a statistically significant effect.
3. Quality Control
Sample distribution is also used in quality control processes to monitor and maintain the quality of products or services. By collecting samples at various stages of production or service delivery, companies can assess the variability and consistency of their outputs.
For example, a manufacturing company may collect samples of finished products and measure certain quality characteristics, such as dimensions or performance. By analyzing the sample distribution of these characteristics, the company can identify any deviations from the desired specifications and take corrective actions to improve the quality of their products.
4. Market Research
Sample distribution is extensively utilized in market research to understand consumer preferences, behavior, and trends. By collecting samples of individuals or households, researchers can gather data on various variables, such as purchasing habits, demographic characteristics, or opinions.
By analyzing the sample distribution, market researchers can identify patterns, correlations, and insights that can inform marketing strategies, product development, or target audience selection. The sample distribution allows researchers to generalize findings to the larger population and make informed decisions based on the collected data.
| Applications | Importance |
|---|---|
| Statistical Inference | Estimating population parameters and assessing uncertainty |
| Hypothesis Testing | Evaluating the validity of claims or hypotheses |
| Quality Control | Monitoring and improving product or service quality |
| Market Research |
Example of Sample Distribution
Let’s consider an example to understand the concept of sample distribution better. Suppose we are interested in studying the heights of students in a particular school. We collect a random sample of 100 students and measure their heights in centimeters. The data we obtain from this sample is our sample distribution.
Now, let’s say we calculate the mean height of the sample and find it to be 165 centimeters. This mean height represents the central tendency of our sample distribution.
Next, we can calculate the standard deviation of the sample to measure the variability of the heights. Let’s assume the standard deviation is 5 centimeters. This indicates that the heights of the students in our sample are relatively close to the mean height of 165 centimeters.
By analyzing the sample distribution, we can make inferences about the population distribution. For example, if the sample distribution is normally distributed, we can assume that the population distribution of heights in the school is also normally distributed.
Furthermore, we can use the sample distribution to estimate population parameters. In our example, we can use the mean height of 165 centimeters from the sample distribution to estimate the mean height of all students in the school.

Emily Bibb simplifies finance through bestselling books and articles, bridging complex concepts for everyday understanding. Engaging audiences via social media, she shares insights for financial success. Active in seminars and philanthropy, Bibb aims to create a more financially informed society, driven by her passion for empowering others.