
What is the McClellan Oscillator?
The McClellan Oscillator is a technical analysis tool that is used to measure the momentum of the stock market. It was developed by Sherman and Marian McClellan in the 1960s and has since become a popular indicator among traders and investors.
The oscillator is calculated by taking the difference between two exponential moving averages (EMA) of advancing and declining issues on the stock market. The EMA is a type of moving average that gives more weight to recent data points, making it more responsive to changes in market conditions.
The McClellan Oscillator is typically displayed as a line chart that fluctuates above and below a zero line. Positive values indicate that the market is bullish, while negative values indicate a bearish market. The magnitude of the values represents the strength of the momentum.
This oscillator is often used in conjunction with other technical indicators to confirm or validate trading signals. It can help traders identify overbought or oversold conditions in the market, as well as potential trend reversals.
Overall, the McClellan Oscillator provides valuable insights into the breadth and direction of the stock market. It can help traders make more informed decisions and improve their overall trading strategies.
Definition and Explanation
The McClellan Oscillator is a technical analysis tool that measures market breadth. It was developed by Sherman and Marian McClellan and is used to analyze the overall health and direction of the stock market. The oscillator is calculated by taking the difference between two exponential moving averages (EMA) of advancing and declining issues.
The McClellan Oscillator is based on the concept that the stock market is a complex system, and analyzing the breadth of market participation can provide valuable insights into market trends. It measures the momentum of advancing and declining stocks and helps identify overbought or oversold conditions in the market.
When the McClellan Oscillator is positive, it indicates that advancing stocks are dominating the market, suggesting a bullish trend. Conversely, when the oscillator is negative, it suggests that declining stocks are dominating the market, indicating a bearish trend. Traders and investors can use this information to make informed decisions about buying or selling stocks.
The McClellan Oscillator is often used in conjunction with other technical analysis tools to confirm or validate market trends. It can be plotted on a chart alongside price data to identify potential turning points or reversals in the market. Traders may also use it to generate buy or sell signals when the oscillator crosses certain thresholds.
It is important to note that the McClellan Oscillator is not a standalone indicator and should be used in conjunction with other forms of analysis. It is just one tool in a trader’s toolbox and should be used in combination with other technical indicators, fundamental analysis, and market sentiment to make well-informed trading decisions.
Uses of the McClellan Oscillator
The McClellan Oscillator is a technical analysis tool that is widely used by traders and investors to gauge the overall health of the stock market. It provides valuable insights into market breadth and can be used to identify potential market turning points.
Here are some of the key uses of the McClellan Oscillator:
- Market Breadth Analysis: The McClellan Oscillator measures the breadth of the market by analyzing the number of advancing and declining stocks. It calculates the difference between the 19-day exponential moving average (EMA) of advancing stocks and the 19-day EMA of declining stocks. A positive value indicates that the market is in a bullish phase, while a negative value suggests a bearish phase.
- Identifying Overbought and Oversold Conditions: The McClellan Oscillator can be used to identify overbought and oversold conditions in the market. When the oscillator reaches extreme levels, such as above +100 or below -100, it indicates that the market is overbought or oversold, respectively. This can be a signal for potential reversals or corrections in the market.
- Confirmation of Market Trends: The McClellan Oscillator can confirm the strength of a market trend. When the oscillator is in sync with the prevailing trend, it provides confirmation that the trend is likely to continue. For example, if the market is in an uptrend and the oscillator remains positive, it suggests that the uptrend is strong and likely to persist.
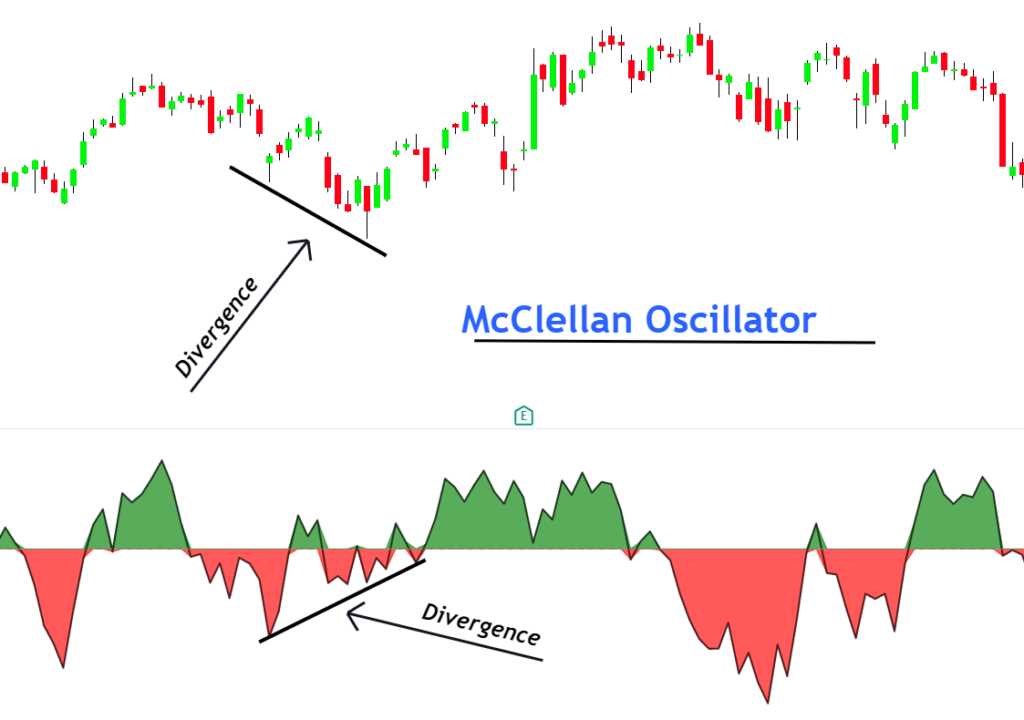
- Divergence Analysis: Divergence occurs when the McClellan Oscillator diverges from the price of the underlying index or stock. This can be a powerful signal of a potential trend reversal. For example, if the price of the index is making higher highs, but the oscillator is making lower highs, it suggests that the uptrend may be losing momentum and a reversal could be imminent.
Technical Analysis Tool
The McClellan Oscillator is a popular technical analysis tool used by traders and investors to gauge the overall health of the stock market. It is based on the concept of market breadth, which refers to the number of advancing and declining stocks in a given market.
Market breadth is an important indicator of market sentiment and can provide valuable insights into the strength or weakness of a market trend. The McClellan Oscillator calculates the difference between the 19-day exponential moving average (EMA) of advancing stocks and the 19-day EMA of declining stocks.
How it Works
The McClellan Oscillator is calculated using the following formula:
- Calculate the daily advances and declines for a given market.
- Calculate the 19-day EMA of the advances and declines.
- Subtract the 19-day EMA of the declines from the 19-day EMA of the advances.
The resulting value is the McClellan Oscillator, which oscillates around a zero line. Positive values indicate that advancing stocks are in control, while negative values indicate that declining stocks are in control.
Interpretation
Traders and investors use the McClellan Oscillator to identify overbought and oversold conditions in the market. When the oscillator reaches extreme levels, it suggests that the market may be due for a reversal. For example, a highly positive reading indicates that the market is overbought and may be ripe for a pullback. Conversely, a highly negative reading suggests that the market is oversold and may be due for a bounce.
In addition to identifying overbought and oversold conditions, the McClellan Oscillator can also be used to confirm the strength of a market trend. If the oscillator is in sync with the prevailing trend, it suggests that the trend is strong and likely to continue. On the other hand, if the oscillator diverges from the trend, it may indicate a weakening trend and possible trend reversal.
Overall, the McClellan Oscillator is a valuable tool for technical analysts and can provide valuable insights into market breadth and sentiment. By monitoring the oscillator, traders and investors can make more informed decisions and improve their trading strategies.
Indications of the McClellan Oscillator
The McClellan Oscillator is a technical analysis tool that provides indications about the market’s overbought or oversold conditions. It is based on the difference between the number of advancing and declining stocks in a given market index, typically the New York Stock Exchange (NYSE).
When the McClellan Oscillator is positive, it suggests that the market is in an overbought condition. This means that there are more advancing stocks than declining stocks, indicating that the market may be due for a correction or a pullback. Traders and investors may consider taking profits or reducing their exposure to the market during this time.
On the other hand, when the McClellan Oscillator is negative, it indicates that the market is in an oversold condition. This means that there are more declining stocks than advancing stocks, suggesting that the market may be due for a rebound or a rally. Traders and investors may consider buying opportunities or increasing their exposure to the market during this time.
It is important to note that the McClellan Oscillator is a short-term indicator and should be used in conjunction with other technical analysis tools and indicators to confirm the market’s direction. It is not a standalone indicator and should be used as part of a comprehensive trading or investment strategy.
Interpreting the McClellan Oscillator

Traders and investors can interpret the McClellan Oscillator in several ways:
- A rising McClellan Oscillator suggests that the market is gaining strength, as more stocks are advancing than declining. This may indicate a bullish market trend.
- A falling McClellan Oscillator suggests that the market is losing strength, as more stocks are declining than advancing. This may indicate a bearish market trend.
- Extreme readings of the McClellan Oscillator, either positive or negative, may suggest that the market is reaching an overbought or oversold condition, respectively. This may indicate a potential reversal in the market’s direction.
Conclusion
The McClellan Oscillator is a valuable technical analysis tool that provides indications about the market’s overbought or oversold conditions. It can help traders and investors make informed decisions about their trading or investment strategies. However, it should be used in conjunction with other technical analysis tools and indicators to confirm the market’s direction. As with any trading or investment strategy, it is important to conduct thorough research and analysis before making any decisions.
Market Overbought or Oversold
The McClellan Oscillator is a technical analysis tool that can be used to determine whether the market is overbought or oversold. This information is valuable for traders and investors who are looking to make informed decisions about buying or selling stocks.
When the McClellan Oscillator is positive, it indicates that the market is overbought. This means that there has been a significant increase in buying pressure, and prices may be due for a correction. Traders who are looking to sell stocks may use this information to time their trades and take advantage of potential price declines.
On the other hand, when the McClellan Oscillator is negative, it suggests that the market is oversold. This means that there has been a significant increase in selling pressure, and prices may be due for a rebound. Traders who are looking to buy stocks may use this information to time their trades and take advantage of potential price increases.
Interpreting the McClellan Oscillator
It is important to note that the McClellan Oscillator is a momentum indicator and should be used in conjunction with other technical analysis tools. Traders and investors should consider other factors such as trend lines, support and resistance levels, and volume before making any trading decisions.
Additionally, it is important to understand that the McClellan Oscillator is not a foolproof indicator. It is based on historical data and is subject to false signals. Traders should use caution and consider other factors before making any trading decisions based solely on the McClellan Oscillator.
Conclusion
Market Breadth
Market breadth refers to the overall health and strength of the market. It provides insights into the level of participation and the underlying trend of the market. The McClellan Oscillator is a technical analysis tool that helps traders and investors gauge market breadth.
The McClellan Oscillator calculates the difference between the number of advancing and declining stocks on a given exchange. It then smooths this data using a moving average to generate a line that oscillates above and below a zero line. This oscillation provides valuable information about the market’s internal strength or weakness.
When the McClellan Oscillator is positive, it indicates that the number of advancing stocks is greater than the number of declining stocks. This suggests that the market is in a healthy state, with broad participation and a positive underlying trend. On the other hand, when the oscillator is negative, it signals that the number of declining stocks is greater than the number of advancing stocks. This indicates a weak market with limited participation and a negative underlying trend.
Traders and investors can use the McClellan Oscillator to identify overbought or oversold conditions in the market. When the oscillator reaches extreme levels, it suggests that the market may be due for a reversal. For example, if the oscillator reaches a highly positive value, it indicates that the market is overbought and may be ripe for a pullback or correction. Conversely, if the oscillator reaches a highly negative value, it suggests that the market is oversold and may be ready for a bounce or rally.
Market breadth is an important concept in technical analysis as it provides a broader perspective on the market’s health and trend. By using the McClellan Oscillator, traders and investors can gain insights into market breadth and make more informed decisions about their trading strategies.

Emily Bibb simplifies finance through bestselling books and articles, bridging complex concepts for everyday understanding. Engaging audiences via social media, she shares insights for financial success. Active in seminars and philanthropy, Bibb aims to create a more financially informed society, driven by her passion for empowering others.