
What is Log-Normal Distribution?
Log-normal distribution is a probability distribution that is commonly used in statistics and finance to model variables that are positively skewed and have a wide range of values. It is a continuous probability distribution of a random variable whose logarithm is normally distributed.
Definition and Explanation
The log-normal distribution is defined by two parameters: the mean (μ) and the standard deviation (σ) of the logarithm of the variable. The mean of the log-normal distribution, denoted as μ, represents the location parameter, while the standard deviation, denoted as σ, represents the scale parameter.
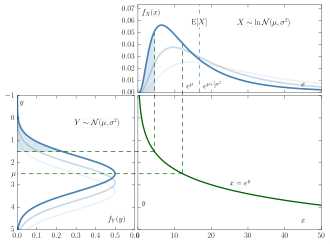
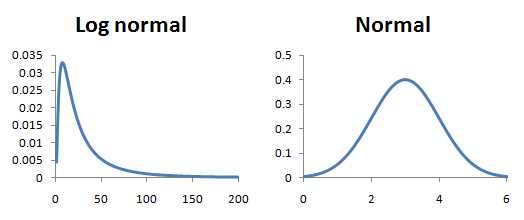
The log-normal distribution is characterized by the fact that the logarithm of the variable follows a normal distribution. This means that if we take the natural logarithm of each value of the variable, the resulting values will be normally distributed.
The log-normal distribution is often used to model variables that are the product of many independent, positive random variables. Examples of variables that can be modeled using the log-normal distribution include stock prices, asset returns, income, and population sizes.
Uses and How to Calculate Log-Normal Distribution
The log-normal distribution has various uses in statistics and finance. It is commonly used in financial modeling to estimate the prices of financial assets, such as stocks and options. It is also used in risk management to model the distribution of potential losses.
To calculate the log-normal distribution, you need to know the mean (μ) and the standard deviation (σ) of the logarithm of the variable. Once you have these parameters, you can use the following formula to calculate the probability density function (PDF) of the log-normal distribution:
| Log-Normal Distribution PDF |
|---|
Where:
- f(x) is the probability density function
- x is the value of the variable
- μ is the mean of the logarithm of the variable
- σ is the standard deviation of the logarithm of the variable
- π is a mathematical constant approximately equal to 3.14159
- ln(x) is the natural logarithm of x
- exp(y) is the exponential function e^y
Practical Applications and Mathematical Formula
The log-normal distribution has practical applications in various fields. In finance, it is used to model the distribution of asset prices and returns. In biology, it is used to model the distribution of population sizes. In economics, it is used to model the distribution of income and wealth.
The mathematical formula for the log-normal distribution is derived from the properties of the normal distribution and the exponential function. It provides a convenient way to model variables that are positively skewed and have a wide range of values.
Definition and Explanation
The log-normal distribution is a probability distribution of a random variable whose logarithm is normally distributed. In other words, if we take the natural logarithm of a log-normal distributed variable, the resulting values will follow a normal distribution.
The log-normal distribution is characterized by two parameters: the mean (μ) and the standard deviation (σ) of the logarithm of the variable. These parameters determine the shape and location of the distribution.
The log-normal distribution is commonly used in various fields, including finance, economics, and biology, to model variables that are inherently positive and have a skewed distribution. Examples of variables that can be modeled using the log-normal distribution include stock prices, income levels, and the size of biological organisms.
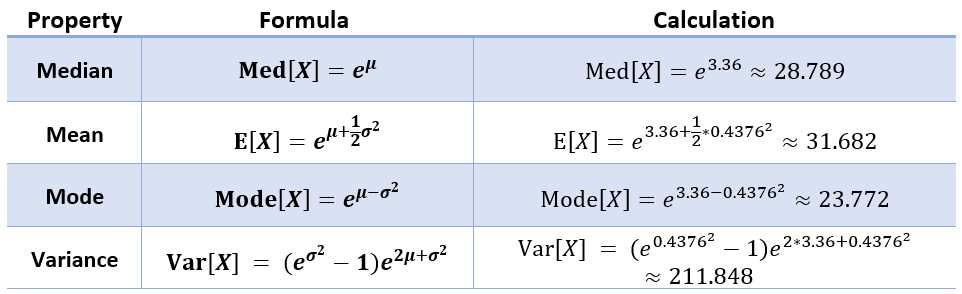
To calculate the log-normal distribution, you need to know the values of the mean (μ) and the standard deviation (σ) of the logarithm of the variable. Once you have these values, you can use mathematical formulas or statistical software to calculate the probability density function (PDF) and cumulative distribution function (CDF) of the log-normal distribution.
The PDF of the log-normal distribution is given by the formula:
where x is the value of the variable, μ is the mean of the logarithm of the variable, and σ is the standard deviation of the logarithm of the variable.
The CDF of the log-normal distribution is given by the formula:
F(x) = ∫[0,x] f(t) dt
where f(t) is the PDF of the log-normal distribution and the integral is taken from 0 to x.
Uses and How to Calculate Log-Normal Distribution
The log-normal distribution is widely used in various fields, including finance, economics, and engineering. It is particularly useful for modeling variables that are expected to have a skewed distribution, such as stock prices, income levels, and population sizes.
Calculation of Log-Normal Distribution
To calculate the log-normal distribution, you need to know the mean (μ) and standard deviation (σ) of the corresponding normal distribution. The formula for calculating the log-normal distribution is as follows:
X = e^(μ + σZ)
Where:
- X is the random variable following a log-normal distribution
- e is the mathematical constant approximately equal to 2.71828
- μ is the mean of the corresponding normal distribution
- σ is the standard deviation of the corresponding normal distribution
- Z is a random variable following a standard normal distribution (mean = 0, standard deviation = 1)
Once you have the values of μ and σ, you can use the formula to calculate the log-normal distribution for any given value of X. This can be done using statistical software or programming languages that have built-in functions for calculating the log-normal distribution.
It is important to note that the log-normal distribution is defined only for positive values of X. If you need to calculate the log-normal distribution for negative values, you can use the absolute value of X and then multiply the result by -1.
Practical Applications and Mathematical Formula
The log-normal distribution has various practical applications in fields such as finance, economics, engineering, and biology. It is commonly used to model variables that are always positive and have a skewed distribution. Here are some examples of its applications:
1. Financial Analysis
In finance, the log-normal distribution is often used to model the returns of assets such as stocks and commodities. It is particularly useful in option pricing models, where the distribution of underlying asset prices is assumed to follow a log-normal distribution. Traders and investors can use the log-normal distribution to estimate the probabilities of different price movements and make informed decisions.
2. Risk Management
The log-normal distribution is also used in risk management to model the distribution of potential losses. By fitting historical data to a log-normal distribution, risk managers can estimate the likelihood of extreme events and calculate value-at-risk (VaR), which is a measure of potential losses within a specified confidence level. This helps organizations assess and mitigate their exposure to financial risks.
3. Biological Sciences
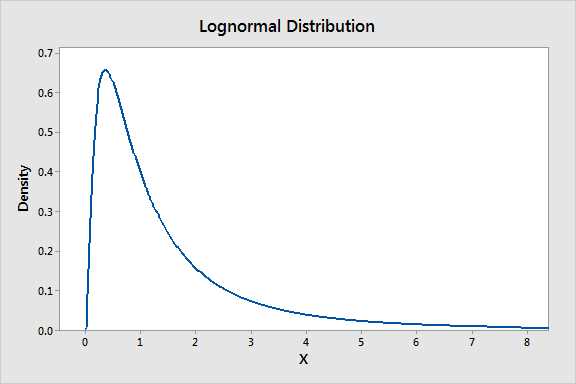
The log-normal distribution is characterized by its probability density function (PDF), which can be expressed as:
Where:
- f(x) is the probability density function
- x is the random variable
- μ is the mean of the natural logarithm of x
- σ is the standard deviation of the natural logarithm of x
- e is the base of the natural logarithm
- π is the mathematical constant pi

Emily Bibb simplifies finance through bestselling books and articles, bridging complex concepts for everyday understanding. Engaging audiences via social media, she shares insights for financial success. Active in seminars and philanthropy, Bibb aims to create a more financially informed society, driven by her passion for empowering others.