
Line of Best Fit Definition
How It Works
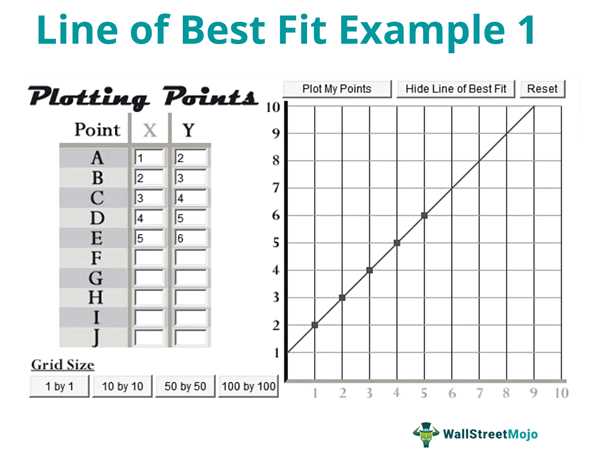
To calculate the line of best fit, we need a set of data points that represent the relationship between the two variables. These data points are plotted on a scatter plot, with the independent variable (x) on the horizontal axis and the dependent variable (y) on the vertical axis.
Once the data points are plotted, we can visually assess the overall trend. If there is a clear linear relationship, we can draw a straight line that best represents this trend. The line should pass through or be as close as possible to the majority of the data points.
The line of best fit can be expressed by the equation y = mx + b, where y is the predicted value of the dependent variable, x is the value of the independent variable, m is the slope of the line, and b is the y-intercept. The slope represents the rate of change in the dependent variable for a one-unit increase in the independent variable.
There are several methods for calculating the line of best fit, depending on the specific circumstances and requirements. Some common methods include:
- Method of least squares: This method minimizes the sum of the squared differences between the observed data points and the predicted values on the line.
- Linear regression: This method uses statistical techniques to estimate the slope and intercept of the line of best fit.
- Graphical methods: These methods involve visually fitting a line to the data points and adjusting it until it represents the overall trend.
Overall, the line of best fit is a valuable tool in data analysis as it allows us to understand and predict the relationship between two variables. By calculating the line, we can make informed decisions and predictions based on the data.
When plotting data points on a scatter plot, it is often desirable to find a line that best represents the overall trend of the data. This line can then be used to make predictions or draw conclusions about the relationship between the variables.
The line of best fit can have different forms, depending on the nature of the data. It can be a straight line, a curved line, or even a polynomial function. The choice of the line of best fit depends on the type of relationship between the variables and the purpose of the analysis.
By examining the line of best fit, analysts can determine the direction and strength of the relationship between the variables. A positive slope indicates a positive relationship, while a negative slope indicates a negative relationship. The steepness of the slope indicates the strength of the relationship.
It is important to note that the line of best fit is an approximation and may not perfectly represent the data. It is a tool used to simplify and summarize the relationship between variables. Therefore, it is essential to interpret the line of best fit in conjunction with other statistical measures and considerations.
How It Works
When plotting a scatter plot of data points, the line of best fit is drawn to minimize the distance between the data points and the line. It represents the average relationship between the variables and can be used to make predictions or analyze the strength of the relationship.
Once the line of best fit is calculated, it can be used to make predictions or estimate values for new data points. The equation of the line can be used to determine the expected value of the dependent variable for a given value of the independent variable.
In addition to analyzing the relationship between variables, the line of best fit can also be used to identify outliers or data points that do not fit the overall trend. These outliers can provide valuable insights into the data and may indicate errors or anomalies in the data collection process.
| Advantages | Disadvantages |
|---|---|
| – Provides a visual representation of the relationship between variables | – Assumes a linear relationship between variables |
| – Allows for predictions and estimations based on the line | – May not accurately represent the relationship for all data points |
| – Can identify outliers or data points that do not fit the trend | – Relies on the assumption of normality and independence of errors |
Calculation Methods
There are several methods to calculate the line of best fit, depending on the data and the desired level of accuracy. Here are some commonly used methods:
1. Least Squares Method
The least squares method is the most commonly used method to calculate the line of best fit. It minimizes the sum of the squared differences between the observed data points and the predicted values on the line. This method finds the line that best fits the data by minimizing the vertical distances between the data points and the line.
To calculate the line of best fit using the least squares method, you need to find the slope (m) and the y-intercept (b) of the line. The formula for the slope is:
where n is the number of data points, ∑xy is the sum of the products of the x and y values, ∑x is the sum of the x values, and ∑y is the sum of the y values.
The formula for the y-intercept is:
2. Excel’s Trendline Function
If you are using Microsoft Excel, you can easily calculate the line of best fit using the Trendline function. This function provides various options to fit different types of curves to the data, including linear, polynomial, exponential, and logarithmic curves.
To calculate the line of best fit using Excel’s Trendline function, select the data points, go to the “Insert” tab, click on “Scatter” in the “Charts” group, and choose the desired scatter plot. Then, right-click on one of the data points, select “Add Trendline,” and choose the desired type of trendline.
3. Statistical Software
If you are working with large datasets or need more advanced statistical analysis, you can use statistical software such as R, Python, or SPSS to calculate the line of best fit. These software packages provide various functions and libraries for linear regression analysis, which can accurately calculate the line of best fit and provide additional statistical measures of fit.
To calculate the line of best fit using statistical software, you need to import the data, specify the dependent and independent variables, and run the linear regression analysis. The software will then provide the slope, y-intercept, and other statistical measures of fit.
Overall, the line of best fit is a useful tool in data analysis and forecasting. By calculating the line that best fits the data, you can make predictions and draw conclusions about the relationship between the variables.

Emily Bibb simplifies finance through bestselling books and articles, bridging complex concepts for everyday understanding. Engaging audiences via social media, she shares insights for financial success. Active in seminars and philanthropy, Bibb aims to create a more financially informed society, driven by her passion for empowering others.