
What is Know Sure Thing (KST)?
Know Sure Thing (KST) is a technical analysis indicator that helps traders and investors identify potential trend reversals and generate trading signals. It was developed by Martin J. Pring, a renowned technical analyst, and is based on the concept of rate of change (ROC).
The KST indicator is designed to smooth out price data and provide a more accurate representation of the underlying trend. It is calculated using a series of moving averages and exponential moving averages, which are weighted based on the rate of change over different time periods.
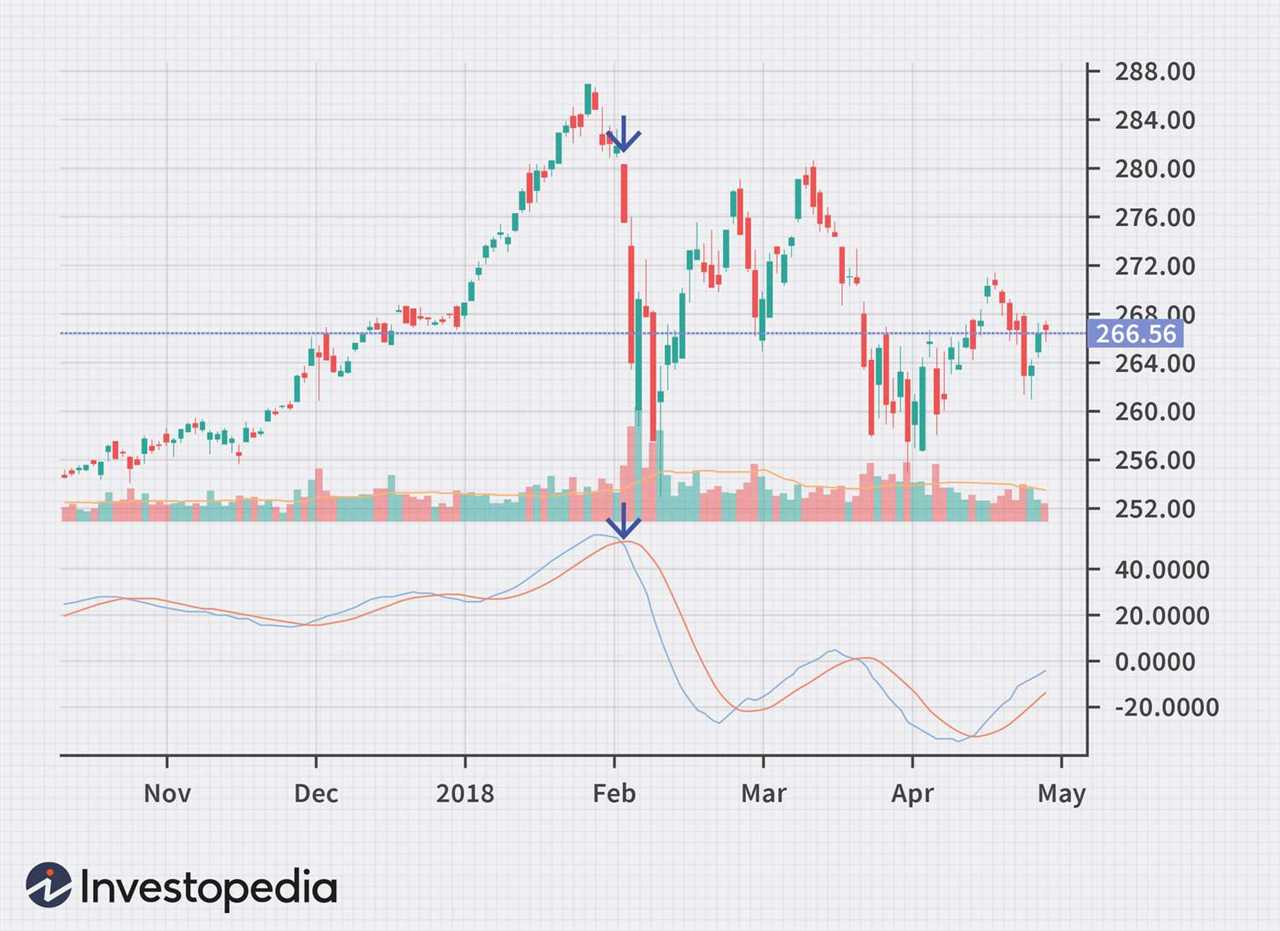
The KST indicator is typically displayed as a line chart that oscillates above and below a zero line. When the KST line crosses above the zero line, it is considered a bullish signal, indicating a potential uptrend. Conversely, when the KST line crosses below the zero line, it is considered a bearish signal, indicating a potential downtrend.
Traders and investors can use the KST indicator in conjunction with other technical analysis tools to confirm trends and make informed trading decisions. It can be applied to various financial instruments, including stocks, commodities, and currencies.
What is Know Sure Thing (KST)?
Know Sure Thing (KST) is a technical analysis indicator that helps traders and investors identify potential trend reversals and confirm the strength of a trend. It was developed by Martin Pring, a renowned technical analyst, and is based on the concept of rate of change (ROC).
The KST indicator combines four different rate of change calculations, each with its own time frame, to provide a comprehensive view of market momentum. By analyzing the KST line and its signal line, traders can gain insights into the overall trend and make informed trading decisions.
The KST indicator is primarily used to identify bullish and bearish divergences between the indicator and the price chart. A bullish divergence occurs when the KST line makes higher lows while the price chart makes lower lows, indicating a potential trend reversal to the upside. On the other hand, a bearish divergence occurs when the KST line makes lower highs while the price chart makes higher highs, indicating a potential trend reversal to the downside.
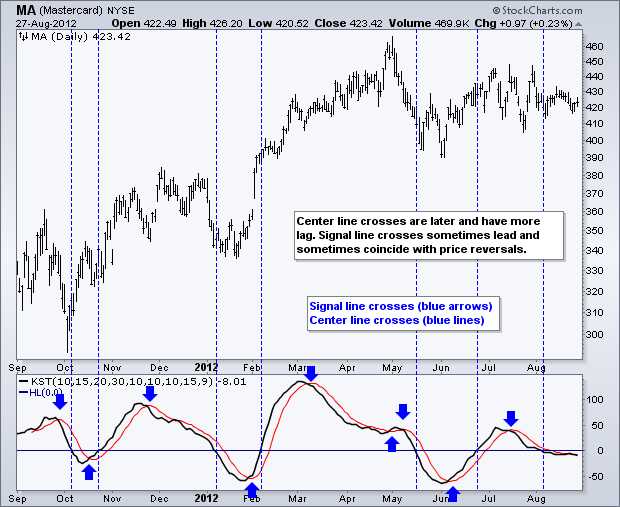
Traders also use the KST indicator to confirm the strength of a trend. When the KST line crosses above its signal line, it suggests a bullish trend, while a cross below the signal line suggests a bearish trend. Additionally, the slope of the KST line can provide further insights into the strength of the trend.
It is important to note that the KST indicator should not be used in isolation but in conjunction with other technical analysis tools and indicators to confirm trading signals. Traders should also consider other factors such as market conditions, fundamental analysis, and risk management before making any trading decisions.
Calculation of Know Sure Thing (KST)
The Know Sure Thing (KST) is a technical analysis indicator that helps traders identify bullish and bearish trends in the market. It is based on the concept of rate of change (ROC) and moving averages.
The calculation of the KST involves four steps:
Step 1: Calculate the Rate of Change (ROC)
First, we need to calculate the rate of change (ROC) for four different time periods. The formula for ROC is:
ROC = (Closing Price / Closing Price n periods ago) * 100
Step 2: Apply Weighted Moving Averages (WMA)
Next, we apply weighted moving averages (WMA) to the ROC values calculated in step 1. The formula for WMA is:
WMA = (ROC x weight) + (ROC x weight) + (ROC x weight) + (ROC x weight)
Step 3: Calculate the Sum of the Weighted Moving Averages
After calculating the WMA for each ROC value, we sum them up to get the Know Sure Thing (KST) line. The formula for the KST line is:
KST Line = WMA(ROC, 10) + WMA(ROC, 15) + WMA(ROC, 20) + WMA(ROC, 30)
Step 4: Apply a Signal Line
Finally, we apply a signal line to the KST line to generate trading signals. The signal line is a simple moving average (SMA) of the KST line. The formula for the signal line is:
Signal Line = SMA(KST Line, n)
By analyzing the KST line and the signal line, traders can determine the strength and direction of the trend. When the KST line crosses above the signal line, it is a bullish signal, indicating a potential buying opportunity. Conversely, when the KST line crosses below the signal line, it is a bearish signal, indicating a potential selling opportunity.
Example of Know Sure Thing (KST) Calculation
Let’s walk through an example to understand how to calculate the Know Sure Thing (KST) indicator. We will use a hypothetical stock price data for this demonstration.
Suppose we have the following closing prices for a stock over a period of time:
| Date | Closing Price |
|---|---|
| Jan 1, 2021 | $10.00 |
| Jan 2, 2021 | $10.50 |
| Jan 3, 2021 | $11.00 |
| Jan 4, 2021 | $10.75 |
| Jan 5, 2021 | $11.25 |
To calculate the KST, we need to follow these steps:
- Apply a weighted moving average (WMA) to the ROC values. The WMA assigns weights to the ROC values based on their time periods. Typically, shorter time periods have higher weights. For example, if we use a 10-day WMA, the weight for the most recent ROC value would be 10, the weight for the second most recent ROC value would be 9, and so on.
- Calculate the sum of the weighted ROC values. This will give us the KST line.
- Apply another WMA to the KST line to smooth out the fluctuations and calculate the signal line.
Using the given closing prices, let’s calculate the KST:
- Calculate the ROC for each closing price:
- Apply a 10-day WMA to the ROC values:
- WMA (Jan 2, 2021) = (5% * 10 + 4.76% * 9 + (-2.27%) * 8 + 4.65% * 7) / (10 + 9 + 8 + 7) = 2.59%
- Calculate the sum of the weighted ROC values:
- KST line (Jan 2, 2021) = 2.59%
- Apply a 10-day WMA to the KST line:
- Signal line (Jan 2, 2021) = 2.59%
Repeat these steps for each subsequent closing price to calculate the KST and signal line for the entire period.
The KST indicator helps traders identify potential trend reversals and generate buy or sell signals. It is considered bullish when the KST line crosses above the signal line and bearish when the KST line crosses below the signal line.
Remember, the example above is for illustrative purposes only. Actual calculations may vary depending on the specific parameters and settings used.
Technical Analysis Basic Education
Technical analysis is a method used by traders and investors to predict future price movements of financial assets based on historical price and volume data. It involves the study of charts, patterns, and indicators to identify trends and make informed trading decisions.
What is Know Sure Thing (KST)?
Know Sure Thing (KST) is a technical indicator developed by Martin Pring. It is used to identify major trend changes and generate buy or sell signals. The KST indicator combines four different timeframes of the rate of change (ROC) indicator to provide a more accurate and reliable signal.
Definition and Explanation
The Know Sure Thing (KST) indicator is a momentum oscillator that measures the rate of change of price over different time periods. It is calculated by summing the rate of change values for four different timeframes and smoothing the result with a moving average.
The KST indicator is typically displayed as a line chart that fluctuates above and below a zero line. When the KST line crosses above the zero line, it is considered a bullish signal, indicating that the momentum is shifting to the upside. Conversely, when the KST line crosses below the zero line, it is considered a bearish signal, indicating that the momentum is shifting to the downside.
Calculation of Know Sure Thing (KST)
The Know Sure Thing (KST) indicator is calculated in four steps:
- Calculate the rate of change (ROC) for four different timeframes (usually 10, 15, 20, and 30 periods).
- Apply different weights to each ROC value, with shorter timeframes receiving higher weights.
- Sum the weighted ROC values to obtain the KST line.
- Smooth the KST line with a moving average to reduce noise and generate trading signals.
Example of Know Sure Thing (KST) Calculation
Let’s assume we have the following rate of change values for the four timeframes:
- 10-period ROC: 2.5
- 15-period ROC: 1.8
- 20-period ROC: 1.3
- 30-period ROC: 0.9
Applying the weights (usually 2, 3, 4, and 5) to each ROC value, we get:
- 10-period ROC: 2.5 * 2 = 5
- 15-period ROC: 1.8 * 3 = 5.4
- 20-period ROC: 1.3 * 4 = 5.2
- 30-period ROC: 0.9 * 5 = 4.5
Summing the weighted ROC values, we obtain the KST line:
KST = 5 + 5.4 + 5.2 + 4.5 = 20.1
Finally, we can smooth the KST line with a moving average to generate trading signals.

Emily Bibb simplifies finance through bestselling books and articles, bridging complex concepts for everyday understanding. Engaging audiences via social media, she shares insights for financial success. Active in seminars and philanthropy, Bibb aims to create a more financially informed society, driven by her passion for empowering others.