
Donchian Channels: Formula, Calculations, and Uses
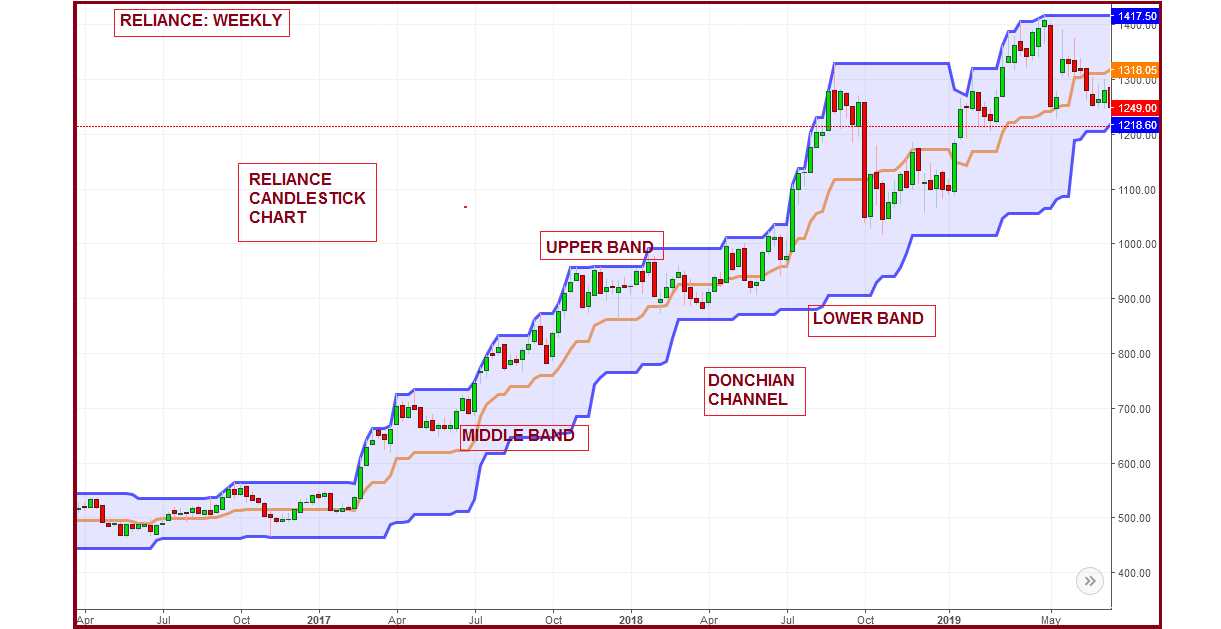
Donchian Channels are a popular technical analysis tool used by traders to identify potential breakout levels and determine the direction of a trend. Developed by Richard Donchian, this indicator consists of three lines: the upper channel line, the lower channel line, and the middle channel line.
Formula and Calculations
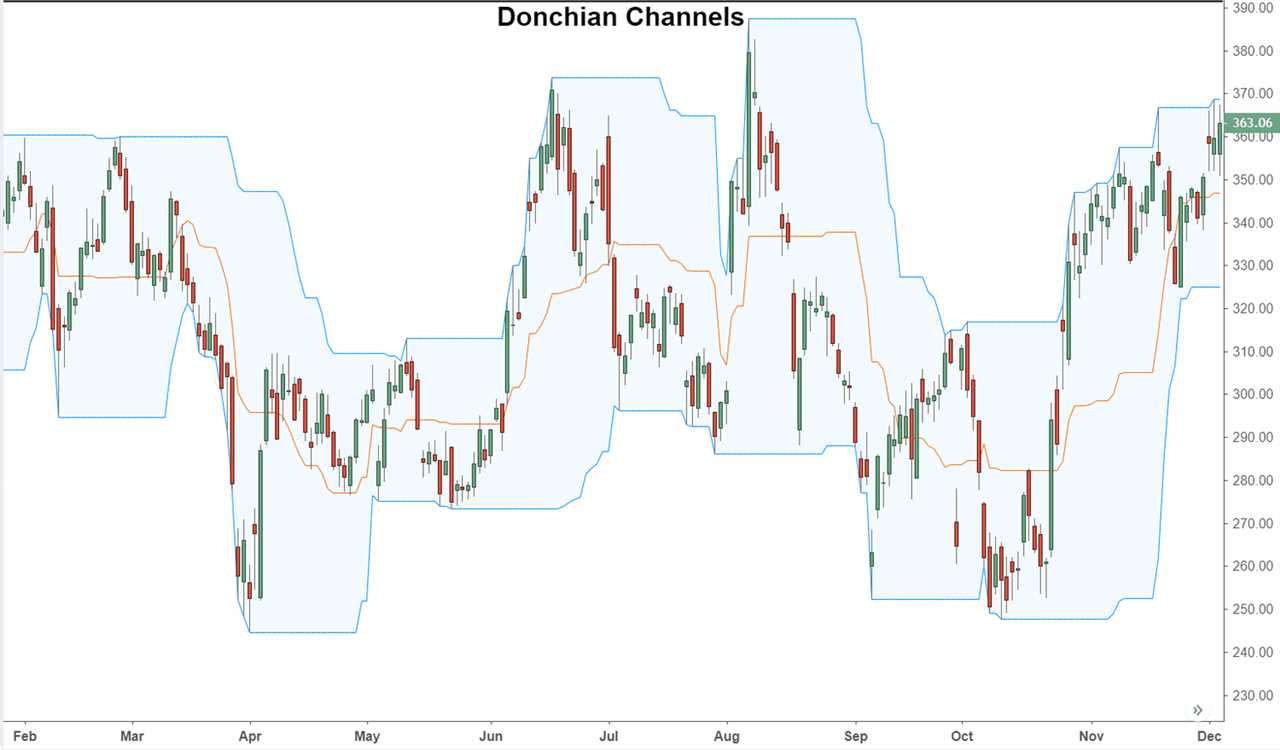
The upper channel line is calculated by finding the highest high over a specified period of time, typically 20 days. The lower channel line is calculated by finding the lowest low over the same period. The middle channel line is simply the average of the upper and lower channel lines.
To calculate the upper channel line:
To calculate the lower channel line:
- Find the lowest low over the specified period.
- Plot a line at this low.
To calculate the middle channel line:
- Calculate the average of the upper and lower channel lines.
- Plot a line at this average.
Uses of Donchian Channels
Donchian Channels can be used in various ways to assist traders in their decision-making process. Here are a few common uses:
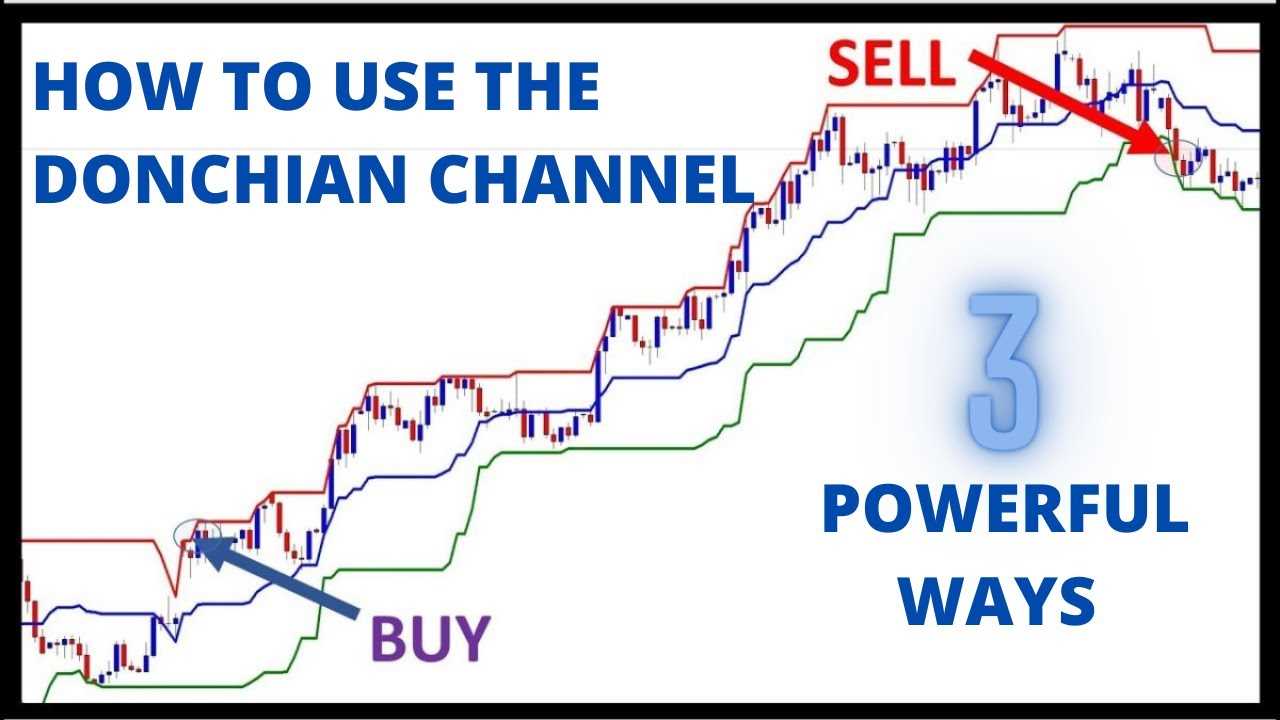
- Identifying Breakouts: Traders can use the upper and lower channel lines to identify potential breakout levels. When the price breaks above the upper channel line, it may indicate a bullish breakout, while a break below the lower channel line may indicate a bearish breakout.
- Determining Trend Direction: The slope of the middle channel line can provide insights into the direction of the trend. If the middle line is sloping upwards, it suggests an uptrend, while a downwards slope indicates a downtrend.
- Setting Stop Loss and Take Profit Levels: Traders can use the upper and lower channel lines as reference points for setting stop loss and take profit levels. For long positions, the lower channel line can be used as a stop loss level, while the upper channel line can be used as a take profit level.
It is important to note that Donchian Channels should not be used in isolation and should be used in conjunction with other technical analysis tools and indicators to make informed trading decisions.
Donchian Channels is a technical analysis tool that was developed by Richard Donchian, a pioneer in the field of trend following. The concept behind Donchian Channels is to identify the highest high and lowest low over a specified period of time, typically 20 days, and create a channel around these values. This channel then serves as a visual representation of the market’s volatility and can be used to identify potential trading opportunities.
How Donchian Channels are Calculated
To calculate Donchian Channels, you need to determine the highest high and lowest low over a specific period of time. The highest high is the highest price reached during that period, while the lowest low is the lowest price reached. These values are then used to create the upper and lower boundaries of the channel.
For example, if you are using a 20-day period, you would calculate the highest high and lowest low for each day over the past 20 days. The highest high would be the highest price reached during those 20 days, and the lowest low would be the lowest price reached. These values are then plotted on a chart to create the upper and lower boundaries of the channel.
Using Donchian Channels in Trading
Donchian Channels can be used in a variety of ways in trading. One common strategy is to enter a long position when the price breaks above the upper boundary of the channel and exit the position when the price breaks below the lower boundary. This strategy is based on the idea that a breakout above the upper boundary indicates a bullish trend, while a breakout below the lower boundary indicates a bearish trend.
Another strategy is to use Donchian Channels to identify support and resistance levels. The upper boundary of the channel can act as a resistance level, while the lower boundary can act as a support level. Traders can look for opportunities to buy near the lower boundary and sell near the upper boundary.

Emily Bibb simplifies finance through bestselling books and articles, bridging complex concepts for everyday understanding. Engaging audiences via social media, she shares insights for financial success. Active in seminars and philanthropy, Bibb aims to create a more financially informed society, driven by her passion for empowering others.