
Common Size Income Statement: Definition and Example
A common size income statement is a financial statement that shows the percentage of each line item relative to a base figure, typically net sales or total revenue. It allows investors and analysts to easily compare the financial performance of different companies or different time periods.
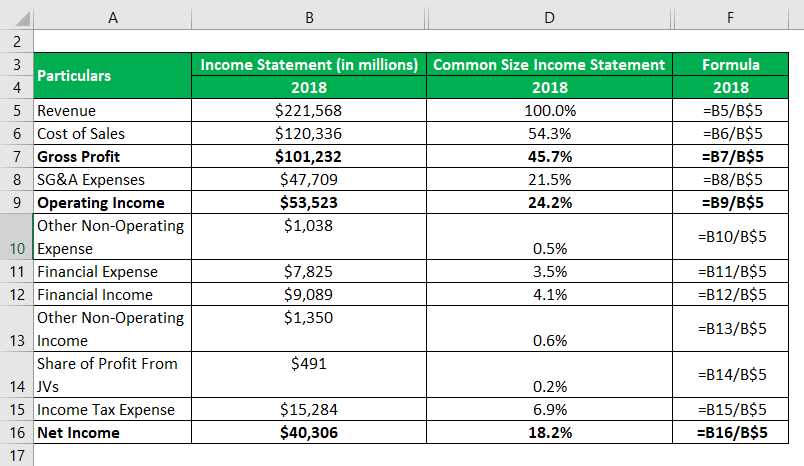
The common size income statement is created by dividing each line item by the base figure and multiplying by 100 to get the percentage. This allows for a standardized comparison of the income statement across companies or time periods, regardless of their size or revenue.
For example, let’s say we have a company with net sales of $1,000,000. The common size income statement would show each line item as a percentage of the net sales. If the cost of goods sold is $500,000, it would be represented as 50% of the net sales. Similarly, if the operating expenses are $200,000, they would be represented as 20% of the net sales.
The common size income statement can be useful for identifying trends and patterns in a company’s financial performance. It can also be used to compare the financial performance of different companies in the same industry. By looking at the percentage breakdown of each line item, investors and analysts can gain insights into how a company is allocating its resources and managing its expenses.
| Line Item | Amount | Percentage of Net Sales |
|---|---|---|
| Net Sales | $1,000,000 | 100% |
| Cost of Goods Sold | $500,000 | 50% |
| Operating Expenses | $200,000 | 20% |
| Net Income | $300,000 | 30% |
What is a Common Size Income Statement?
The common size income statement is used to analyze the financial performance of a company over a period of time and to compare it with other companies in the same industry. By presenting the financial information in a standardized format, it allows for easier comparison and identification of trends.
For example, if a company has a total revenue of $1 million and its cost of goods sold is $500,000, the common size income statement would show that the cost of goods sold is 50% of the total revenue. This information can be compared to industry benchmarks or previous periods to assess the company’s efficiency in managing its costs.
The common size income statement can be a valuable tool for investors, analysts, and managers to assess the financial health and performance of a company. It provides a clear and standardized view of the company’s financials, allowing for easier comparison and analysis.
Example of a Common Size Income Statement
A common size income statement is a financial statement that presents the income statement data in a standardized format, allowing for easy comparison between different periods or companies. It expresses each line item as a percentage of net sales, which helps to identify trends and analyze the financial performance of a company.
Let’s take a look at an example of a common size income statement for Company XYZ:
Company XYZ Common Size Income Statement
| Line Item | Amount | % of Net Sales |
|---|---|---|
| Net Sales | $1,000,000 | 100% |
| Cost of Goods Sold | $600,000 | 60% |
| Gross Profit | $400,000 | 40% |
| Operating Expenses | $200,000 | 20% |
| Net Income | $200,000 | 20% |
Overall, a common size income statement is a valuable tool for financial analysis and can provide insights into a company’s financial performance and trends.

Emily Bibb simplifies finance through bestselling books and articles, bridging complex concepts for everyday understanding. Engaging audiences via social media, she shares insights for financial success. Active in seminars and philanthropy, Bibb aims to create a more financially informed society, driven by her passion for empowering others.