
Coefficient of Determination Calculation and Interpretation
The coefficient of determination is a statistical measure that assesses the proportion of the variance in the dependent variable that can be explained by the independent variable(s). It is commonly denoted as R-squared or R^2.
To calculate the coefficient of determination, you need to first perform a regression analysis. This involves fitting a regression model to your data and estimating the coefficients of the independent variables. Once you have the estimated coefficients, you can calculate the predicted values of the dependent variable.
Next, you need to calculate the total sum of squares (SST), which represents the total variation in the dependent variable. This can be done by taking the sum of the squared differences between each observed value of the dependent variable and the mean of the dependent variable.
Then, you calculate the residual sum of squares (SSE), which represents the unexplained variation in the dependent variable. This can be done by taking the sum of the squared differences between each observed value of the dependent variable and the corresponding predicted value from the regression model.
Finally, you can calculate the coefficient of determination by subtracting the SSE from the SST and dividing the result by the SST. The coefficient of determination will always be between 0 and 1, where 0 indicates that none of the variance in the dependent variable is explained by the independent variable(s), and 1 indicates that all of the variance is explained.
The coefficient of determination is a statistical measure that helps to assess the strength and quality of a regression model. It provides insights into how well the independent variable(s) explain the variation in the dependent variable. In other words, it quantifies the proportion of the total variation in the dependent variable that can be explained by the independent variable(s).
The coefficient of determination, often denoted as R-squared (R²), ranges from 0 to 1. A value of 0 indicates that the independent variable(s) have no explanatory power, while a value of 1 indicates a perfect fit where the independent variable(s) can completely explain the variation in the dependent variable.
It is important to note that a high R-squared value does not necessarily imply causation. It only indicates the strength of the relationship between the independent and dependent variables. Other factors, such as omitted variables or measurement errors, may also influence the dependent variable.
When interpreting the coefficient of determination, it is crucial to consider the context of the analysis and the specific variables involved. Additionally, comparing the R-squared values of different regression models can help determine which model provides a better fit to the data.
Calculation of the Coefficient of Determination
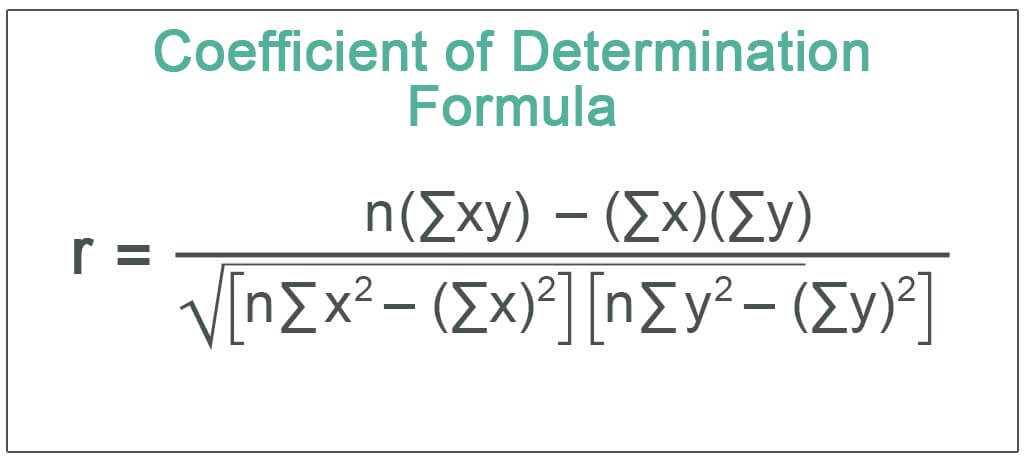
To calculate the coefficient of determination, you need to have data for both the dependent variable and the independent variable(s). The formula for calculating R-squared is:
R-squared = (SSR / SST)
Where:
- SSR (Sum of Squares Regression) is the sum of the squared differences between the predicted values and the mean of the dependent variable.
- SST (Total Sum of Squares) is the sum of the squared differences between the actual values and the mean of the dependent variable.
The value of R-squared ranges from 0 to 1, where 0 indicates that the independent variable(s) have no explanatory power on the dependent variable, and 1 indicates a perfect fit where the independent variable(s) can explain all the variation in the dependent variable.
It is also important to consider the limitations of R-squared. It can be influenced by outliers, the number of variables included in the model, and the distribution of the data. Therefore, it is always recommended to interpret R-squared in conjunction with other statistical measures and to assess the overall validity and reliability of the regression model.
Interpreting the Coefficient of Determination
R-squared ranges from 0 to 1, where 0 indicates that the independent variable(s) have no explanatory power on the dependent variable, and 1 indicates a perfect fit where all the variance in the dependent variable is explained by the independent variable(s). However, it is rare to achieve a perfect fit in real-world scenarios.
When interpreting R-squared, it is important to keep in mind that a high R-squared does not necessarily imply causation. It only indicates the strength of the relationship between variables. Other factors, such as omitted variables or measurement errors, may also influence the relationship.
Interpreting R-squared Values
Typically, a higher R-squared value indicates a better fit of the regression model. However, the interpretation of R-squared values can vary depending on the context and the field of study.
In financial analysis, an R-squared value of 0.70 or higher is often considered strong, indicating that 70% or more of the variance in the dependent variable is explained by the independent variable(s). This suggests a significant relationship between the variables and provides confidence in the predictive power of the model.
Limitations of R-squared
While R-squared is a useful measure, it has certain limitations that should be considered. Firstly, it does not indicate the direction or nature of the relationship between variables. Additionally, it does not account for the statistical significance of the coefficients or the presence of outliers.
Furthermore, R-squared is sensitive to the number of independent variables included in the model. Adding more variables may increase the R-squared value, even if the additional variables do not have a meaningful impact on the dependent variable.
Conclusion

Emily Bibb simplifies finance through bestselling books and articles, bridging complex concepts for everyday understanding. Engaging audiences via social media, she shares insights for financial success. Active in seminars and philanthropy, Bibb aims to create a more financially informed society, driven by her passion for empowering others.