
What is the Co-efficient of Variation?
The co-efficient of variation (CV) is a statistical measure that is used to assess the relative variability of a dataset. It is a standardized measure that allows for the comparison of variability between different datasets, regardless of their units of measurement. The CV is particularly useful when comparing datasets with different means or scales.
To calculate the CV, the standard deviation (SD) is divided by the mean and multiplied by 100. The formula for CV is as follows:
CV = (SD / Mean) * 100
The CV is expressed as a percentage and provides a measure of the relative variability of the dataset. A higher CV indicates a greater degree of variability, while a lower CV indicates a smaller degree of variability.
Why is the Co-efficient of Variation important?
The CV is an important statistical tool that is widely used in various fields, including finance, economics, and biology. It provides valuable insights into the variability of data and allows for the comparison of datasets with different means and scales.
By calculating the CV, analysts and researchers can determine the level of risk or uncertainty associated with a particular dataset. For example, in finance, the CV can be used to assess the risk of different investment portfolios. A higher CV indicates a riskier portfolio with greater potential for volatility, while a lower CV indicates a more stable and predictable portfolio.
The CV is also useful in quality control and manufacturing processes. It can be used to assess the variability of product measurements and determine whether a process is stable and within acceptable limits. A higher CV in product measurements may indicate a higher likelihood of defects or inconsistencies in the manufacturing process.
Limitations of the Co-efficient of Variation
While the CV is a useful measure of relative variability, it does have some limitations. One limitation is that it is sensitive to extreme values or outliers in the dataset. Outliers can significantly affect the standard deviation and, consequently, the CV. Therefore, it is important to consider the presence of outliers when interpreting the CV.
Despite these limitations, the CV remains a widely used and valuable statistical tool for assessing the relative variability of datasets. It provides a standardized measure that allows for meaningful comparisons and insights into the variability of data.
Calculating the Co-efficient of Variation
The co-efficient of variation (CV) is a statistical measure that is used to measure the relative variability of a data set. It is calculated by dividing the standard deviation of the data set by the mean and then multiplying by 100. The formula for calculating the CV is as follows:
CV = (Standard Deviation / Mean) * 100
To calculate the CV, first calculate the standard deviation of the data set. The standard deviation measures the dispersion or spread of the data set. It quantifies how much the values in the data set deviate from the mean. Once the standard deviation is calculated, divide it by the mean and multiply by 100 to get the CV.
The CV is typically expressed as a percentage. A higher CV indicates a higher degree of variability in the data set, while a lower CV indicates a lower degree of variability. The CV is useful for comparing the variability of different data sets, especially when the means of the data sets are different.
For example, let’s say we have two data sets: Data Set A and Data Set B. Data Set A has a mean of 50 and a standard deviation of 10, while Data Set B has a mean of 100 and a standard deviation of 20. The CV for Data Set A would be (10/50) * 100 = 20%, and the CV for Data Set B would be (20/100) * 100 = 20%. Even though the standard deviation of Data Set B is higher than that of Data Set A, the CVs are the same because the standard deviations are proportional to the means.
The CV is particularly useful in comparing the variability of different data sets that have different units of measurement. For example, if we are comparing the variability of the heights and weights of a group of individuals, the CV allows us to make a meaningful comparison even though the units of measurement are different.
Interpreting the Co-efficient of Variation
The co-efficient of variation (CV) is a statistical measure that is used to assess the relative variability of a dataset. It is particularly useful when comparing the variability of different datasets that have different units of measurement or scales. The CV is expressed as a percentage and is calculated by dividing the standard deviation of a dataset by its mean and then multiplying by 100.
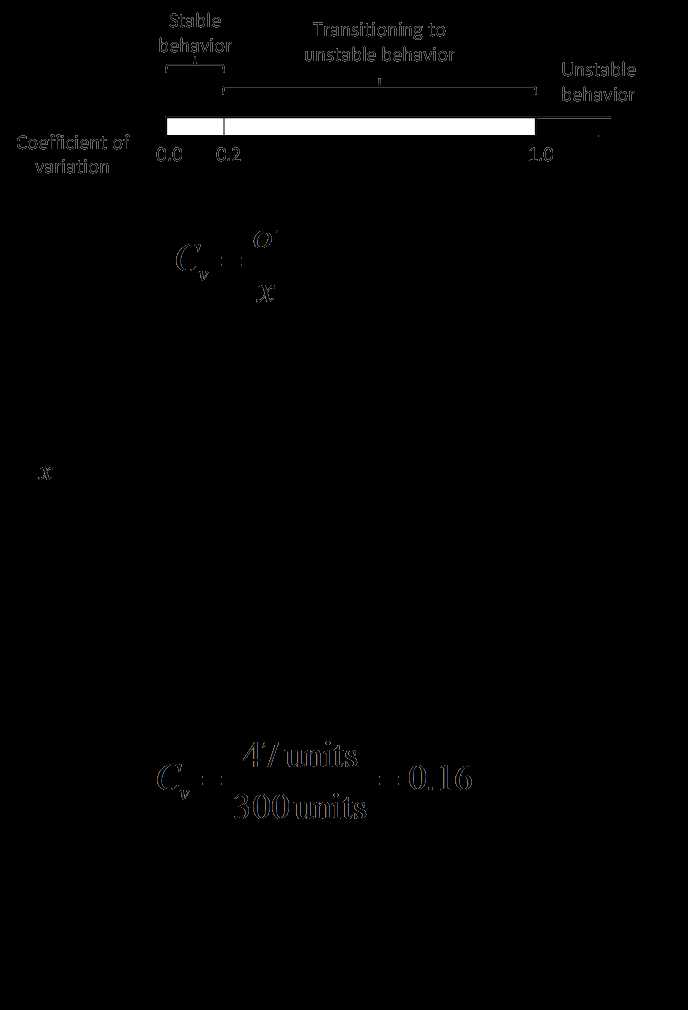
A low CV indicates that the dataset has low variability, meaning that the values are relatively close to the mean. On the other hand, a high CV suggests that the dataset has high variability, indicating that the values are spread out from the mean.
When interpreting the CV, it is important to consider the context and the specific characteristics of the dataset. For example, in financial analysis, a low CV for a company’s stock returns may indicate a stable and predictable investment, while a high CV may suggest a riskier and more volatile investment.
Furthermore, the CV can be used to compare the variability of different datasets. If two datasets have similar means but different CVs, the dataset with the lower CV is considered to have less variability and therefore may be considered more reliable or less risky.
However, it is important to note that the CV has limitations and should be used in conjunction with other statistical measures. For example, the CV does not provide information about the direction of the variability or the shape of the distribution. Additionally, the CV is sensitive to outliers, which can significantly affect its value.
Practical Applications of the Co-efficient of Variation
The co-efficient of variation (CV) is a statistical measure that is widely used in various fields to assess the relative variability of data sets. It provides valuable insights into the consistency and stability of a dataset, making it a useful tool for decision-making and risk management. Here are some practical applications of the co-efficient of variation:
1. Investment Analysis
In the field of finance, the co-efficient of variation is commonly used to compare the risk and return of different investment opportunities. By calculating the CV of various investment portfolios or assets, investors can determine which option offers the most favorable risk-return tradeoff. A lower CV indicates a more stable and predictable investment, while a higher CV suggests higher volatility and potential for greater returns.
2. Quality Control
In manufacturing and production processes, the co-efficient of variation is used to assess the consistency and reliability of product quality. By calculating the CV of key performance indicators, such as product dimensions or defect rates, manufacturers can identify variations and take corrective actions to improve quality control. A lower CV indicates a more consistent and reliable production process, while a higher CV suggests higher variability and potential quality issues.
3. Supply Chain Management

In supply chain management, the co-efficient of variation is used to evaluate the reliability and efficiency of suppliers. By calculating the CV of key performance metrics, such as delivery times or order accuracy, companies can identify suppliers with the most consistent and reliable performance. A lower CV indicates a more dependable supplier, while a higher CV suggests higher variability and potential disruptions in the supply chain.
4. Risk Assessment
The co-efficient of variation is also used in risk assessment and insurance underwriting. By calculating the CV of historical loss data or claim frequencies, insurers can assess the volatility and potential losses associated with different risk profiles. A lower CV indicates a more stable and predictable risk, while a higher CV suggests higher volatility and potential for larger losses.
Overall, the co-efficient of variation is a versatile tool that can be applied in various industries and contexts. It provides a quantitative measure of variability, allowing decision-makers to make informed choices and manage risks effectively.
Limitations of the Co-efficient of Variation
The co-efficient of variation (CV) is a useful statistical measure that allows for the comparison of variability between different sets of data. However, it is important to recognize that the CV has certain limitations that should be taken into consideration when interpreting its results.
Firstly, the CV is only applicable to data sets that have a non-zero mean. This means that if the mean of a data set is zero or close to zero, the CV will be undefined or unreliable. Therefore, it is important to ensure that the data being analyzed has a meaningful mean value before using the CV.
Secondly, the CV is a relative measure of variability and does not provide information about the absolute magnitude of the data. This means that two data sets with the same CV can have very different levels of variability in absolute terms. For example, a CV of 50% could represent a high level of variability if the mean is small, but a low level of variability if the mean is large. Therefore, it is important to consider the context and magnitude of the data when interpreting the CV.
Lastly, the CV is sensitive to outliers in the data. Outliers are extreme values that are significantly different from the rest of the data. If a data set contains outliers, the CV may be skewed and not accurately reflect the true variability of the data. Therefore, it is important to identify and handle outliers appropriately before calculating the CV.
| Limitation | Explanation |
|---|---|
| Applicable to non-zero mean data only | The CV is undefined or unreliable if the mean is zero or close to zero. |
| Relative measure of variability | The CV does not provide information about the absolute magnitude of the data. |
| Assumes normal distribution | The CV may not accurately represent the variability if the data is not normally distributed. |
| Sensitive to outliers | The CV may be skewed if the data contains outliers. |
Despite these limitations, the co-efficient of variation can still be a valuable tool for comparing variability between different data sets. However, it is important to use it in conjunction with other statistical measures and to consider the specific characteristics of the data being analyzed.

Emily Bibb simplifies finance through bestselling books and articles, bridging complex concepts for everyday understanding. Engaging audiences via social media, she shares insights for financial success. Active in seminars and philanthropy, Bibb aims to create a more financially informed society, driven by her passion for empowering others.