
Symmetrical Distribution Defined
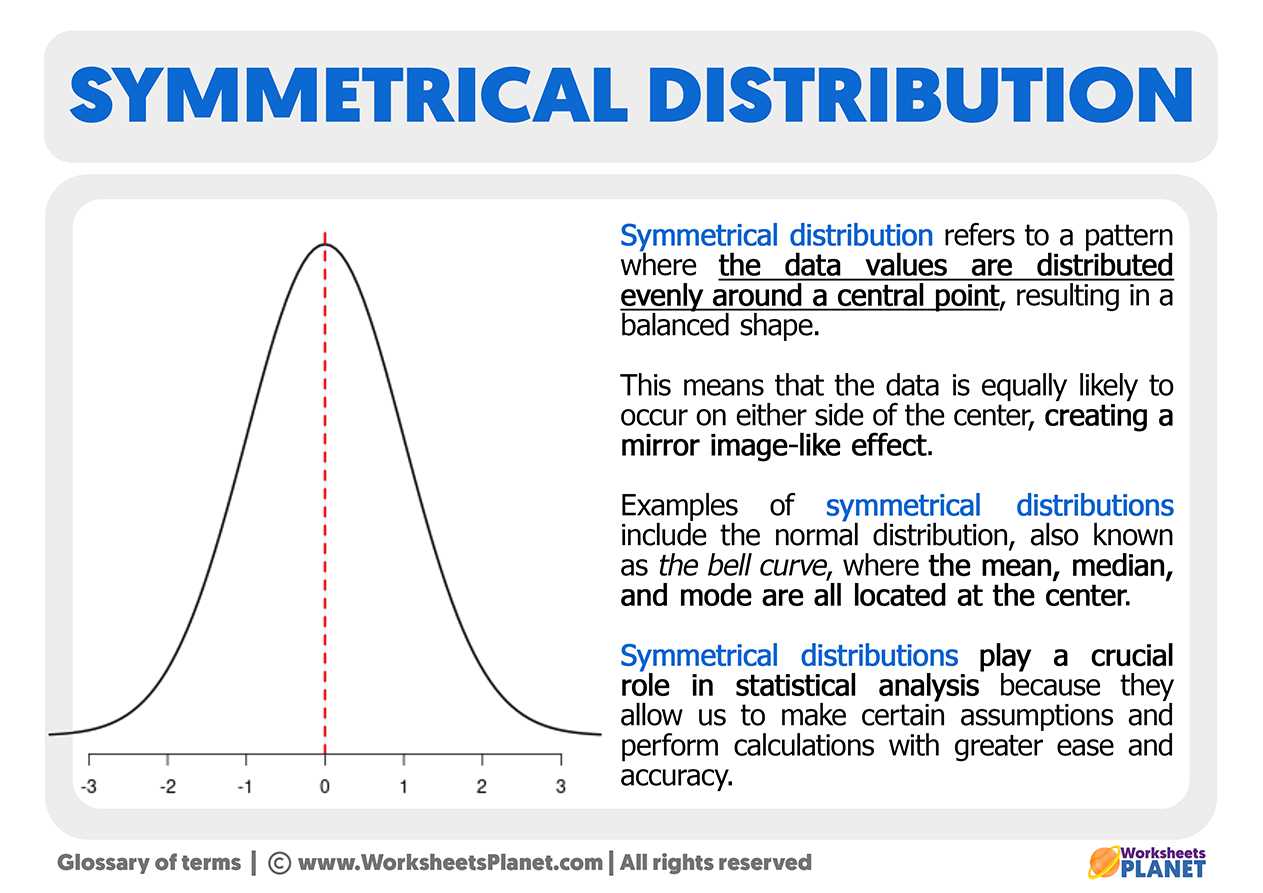
The symmetrical distribution is characterized by its bell-shaped curve, which is symmetrical around the mean. The curve is smooth and continuous, with the highest point at the mean and gradually decreasing towards the tails on both sides.
One key characteristic of a symmetrical distribution is that the mean, median, and mode are all equal. The mean is the average of all the data points, the median is the middle value when the data is arranged in ascending or descending order, and the mode is the value that appears most frequently. In a symmetrical distribution, these three measures of central tendency coincide.
| Advantages | Disadvantages |
|---|---|
| Easy to understand and interpret | May not accurately represent all types of data |
| Allows for the use of many statistical tests and techniques | Assumes a normal distribution, which may not always be the case |
| Provides a basis for making predictions and inferences | Outliers can significantly affect the mean and skew the distribution |
When analyzing a symmetrical distribution, it is important to understand its key characteristics and how to interpret the data. This can provide valuable insights into the underlying patterns and trends.
Key Characteristics of Symmetrical Distribution
1. Mean: The mean of a symmetrical distribution is located at the center of the distribution. It represents the average value of the data set.
2. Median: The median of a symmetrical distribution is also located at the center of the distribution. It is the value that divides the data set into two equal halves.
3. Mode: The mode of a symmetrical distribution is the value that occurs most frequently. In a symmetrical distribution, the mode is equal to the mean and the median.
4. Skewness: A symmetrical distribution has zero skewness, which means that the data is evenly distributed around the mean without any significant outliers or skewness towards one side.
5. Standard Deviation: The standard deviation of a symmetrical distribution measures the spread of the data around the mean. It indicates how closely the data points cluster around the mean.
Interpreting Symmetrical Distribution
A symmetrical distribution allows for easier interpretation and analysis of the data. Here are some key points to consider:
- If the data is normally distributed, the mean, median, and mode will be approximately equal.
- If the data is skewed, the mean will be pulled towards the direction of the skewness.
- The standard deviation can provide insights into the variability of the data. A smaller standard deviation indicates that the data points are closely clustered around the mean, while a larger standard deviation suggests a wider spread.
- By analyzing the symmetrical distribution, you can identify any outliers or unusual patterns in the data.
Key Characteristics of Symmetrical Distribution
There are several key characteristics of a symmetrical distribution:
1. Mean, Median, and Mode:
In a symmetrical distribution, the mean, median, and mode are all equal and located at the center of the distribution. This means that the average value, the middle value, and the most frequently occurring value are all the same.
2. Bell-shaped Curve:
A symmetrical distribution is represented by a bell-shaped curve, with the highest point at the mean and the tails extending symmetrically on both sides. The curve is symmetrical, meaning that the data is equally distributed around the mean.
3. Skewness:
A symmetrical distribution has zero skewness, which means that the data is not skewed to the left or right. The distribution is balanced and does not have a long tail on one side.
4. Standard Deviation:
The standard deviation of a symmetrical distribution is a measure of the spread or variability of the data. It represents the average distance of each data point from the mean. In a symmetrical distribution, the standard deviation is equal on both sides of the mean.
5. Probability Density Function:
Interpreting Symmetrical Distribution
A symmetrical distribution is a statistical term used to describe a data set in which the values are evenly distributed around the mean. In other words, the data is balanced and shows no skewness or bias towards one side.
Characteristics of Symmetrical Distribution
There are several key characteristics that can help in interpreting a symmetrical distribution:
- Mean, Median, and Mode: In a symmetrical distribution, the mean, median, and mode are all equal. This indicates that the central tendency of the data is located at the center of the distribution.
- Equal Tails: The tails of a symmetrical distribution are equal in length and shape. This means that the probabilities of observing values above or below the mean are the same.
- Skewness: A symmetrical distribution has a skewness value of zero. Skewness measures the asymmetry of a distribution, and a value of zero indicates perfect symmetry.
Interpreting a Symmetrical Distribution
When encountering a symmetrical distribution, it is important to consider the following:
- Data Balance: The symmetrical distribution suggests that the data is evenly distributed, with no significant outliers or biases towards specific values.
- Central Tendency: The mean, median, and mode being equal indicate that the central tendency of the data is located at the center of the distribution.
- Normality: The bell-shaped curve of a symmetrical distribution suggests that the data follows a normal distribution. This can be useful for making predictions and estimating probabilities.
- Equal Tails: The equal lengths and shapes of the tails indicate that the probabilities of observing values above or below the mean are the same.
Examples of Symmetrical Distribution
Here are some examples of symmetrical distributions:
1. Height of Adult Males
One example of a symmetrical distribution is the height of adult males. In a large population, the distribution of heights tends to follow a bell-shaped curve, with the majority of individuals falling around the average height. The mean, median, and mode of the distribution will all be equal and located at the center of the curve.
2. Test Scores
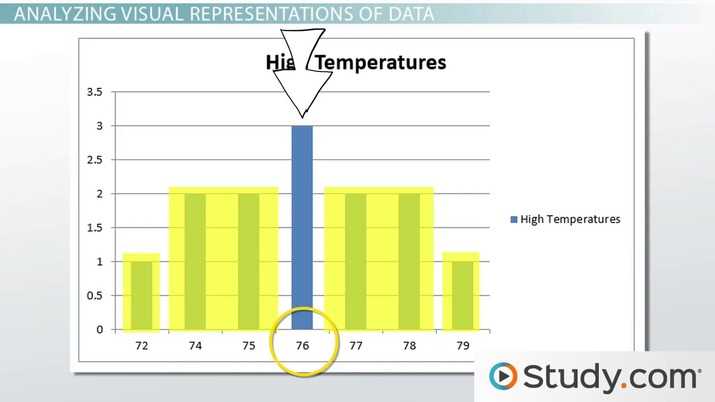
Another example is the distribution of test scores. In a well-designed test, the scores of a large group of students will often follow a symmetrical distribution. The majority of students will score around the average, resulting in a bell-shaped curve. The mean, median, and mode will all be equal and located at the center of the distribution.

Emily Bibb simplifies finance through bestselling books and articles, bridging complex concepts for everyday understanding. Engaging audiences via social media, she shares insights for financial success. Active in seminars and philanthropy, Bibb aims to create a more financially informed society, driven by her passion for empowering others.