
High-Low Index: Definition, Formula, Example, and Chart
The High-Low Index is a technical analysis tool used by traders and investors to measure the market’s breadth and identify potential trend reversals. It compares the number of stocks reaching new highs to the number of stocks reaching new lows over a specific period of time.
Definition
The High-Low Index is a ratio that is calculated by dividing the number of stocks making new highs by the sum of the number of stocks making new highs and the number of stocks making new lows. The resulting value is then multiplied by 100 to express it as a percentage.
Formula
The formula for calculating the High-Low Index is as follows:
High-Low Index = (Number of Stocks Making New Highs / (Number of Stocks Making New Highs + Number of Stocks Making New Lows)) * 100
Example
Let’s say that on a given trading day, there are 200 stocks making new highs and 100 stocks making new lows. Using the formula, we can calculate the High-Low Index as follows:
High-Low Index = (200 / (200 + 100)) * 100 = 66.67%
This means that 66.67% of the stocks are making new highs, while the remaining 33.33% are making new lows.
Chart
A High-Low Index chart is a graphical representation of the High-Low Index over time. It typically consists of a line graph that plots the High-Low Index values on the y-axis and the corresponding dates or time periods on the x-axis. Traders and investors use these charts to identify potential market reversals or confirm the strength of a trend.
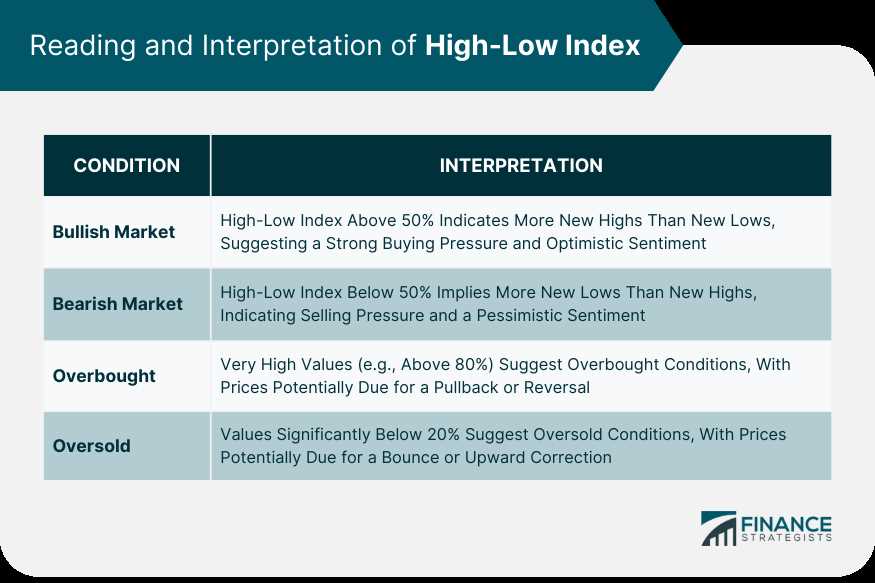
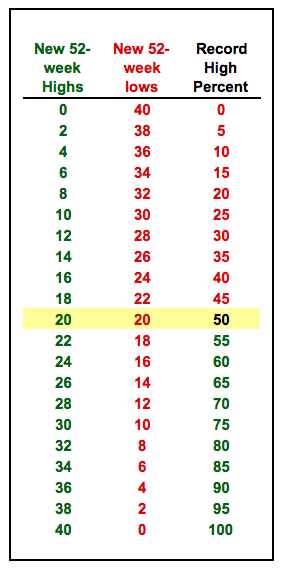
By analyzing the High-Low Index, traders can gain insights into the overall market sentiment and determine whether the market is experiencing a bullish or bearish trend. A High-Low Index above 50% is generally considered bullish, indicating that more stocks are making new highs than new lows. Conversely, a High-Low Index below 50% is considered bearish, suggesting that more stocks are making new lows than new highs.
What is the High-Low Index?
The High-Low Index is a technical analysis tool that measures the number of new highs and new lows in a particular market or sector. It provides insights into the overall strength or weakness of the market by comparing the number of stocks reaching new highs to the number of stocks reaching new lows.
This index is commonly used by traders and investors to identify potential trend reversals or confirm the strength of an existing trend. It can be applied to various timeframes, such as daily, weekly, or monthly, depending on the trader’s preference.
How does the High-Low Index work?
The High-Low Index is calculated by dividing the number of stocks making new highs by the sum of the number of stocks making new highs and the number of stocks making new lows. The result is then multiplied by 100 to convert it into a percentage.
For example, if there are 100 stocks making new highs and 50 stocks making new lows, the High-Low Index would be calculated as follows:
| Number of Stocks Making New Highs | Number of Stocks Making New Lows | High-Low Index |
|---|---|---|
| 100 | 50 | (100 / (100 + 50)) * 100 = 66.67% |
The High-Low Index is typically plotted on a chart, allowing traders to visually analyze the relationship between new highs and new lows over time. It can help identify periods of market strength or weakness, as well as potential turning points.
Overall, the High-Low Index is a valuable tool for technical analysis, providing traders with a quantitative measure of market breadth and helping them make informed trading decisions.
How is the High-Low Index Calculated?
The High-Low Index is a technical analysis tool that is used to measure the strength of a trend in the stock market. It is calculated by taking the difference between the number of stocks that have reached a new high and the number of stocks that have reached a new low, and then dividing that difference by the total number of stocks traded.
To calculate the High-Low Index, you first need to determine the number of stocks that have reached a new high and the number of stocks that have reached a new low. This can be done by comparing the current day’s high and low prices with the previous day’s high and low prices.
Once you have the number of stocks that have reached a new high and the number of stocks that have reached a new low, you can calculate the High-Low Index using the following formula:
The High-Low Index is typically expressed as a percentage or a ratio. A value above 50% indicates that more stocks are reaching new highs than new lows, which suggests a bullish market. Conversely, a value below 50% indicates that more stocks are reaching new lows than new highs, which suggests a bearish market.
Example:
Let’s say that on a particular trading day, there were 100 stocks that reached a new high and 50 stocks that reached a new low. The total number of stocks traded that day was 500.
Using the formula, we can calculate the High-Low Index as follows:
The High-Low Index can be plotted on a chart to visually represent the strength of the trend. Traders and investors can use this information to make informed decisions about buying or selling stocks.
Example of High-Low Index Calculation
Let’s walk through an example to understand how the High-Low Index is calculated. Suppose we have the following data for a particular stock:
- Day 1: High = $50, Low = $45
- Day 2: High = $55, Low = $48
- Day 3: High = $52, Low = $47
- Day 4: High = $58, Low = $50
- Day 5: High = $60, Low = $52
For each day, we calculate the midpoint and compare it to the closing price. If the closing price is higher than the midpoint, we count it as a positive day. If the closing price is lower than the midpoint, we count it as a negative day. If the closing price is equal to the midpoint, we do not count it.
Let’s calculate the High-Low Index for our example:
- Day 1: Midpoint = ($50 + $45) / 2 = $47.50, Closing Price = $48 (Positive Day)
- Day 2: Midpoint = ($55 + $48) / 2 = $51.50, Closing Price = $50 (Negative Day)
- Day 3: Midpoint = ($52 + $47) / 2 = $49.50, Closing Price = $51 (Positive Day)
- Day 4: Midpoint = ($58 + $50) / 2 = $54, Closing Price = $55 (Positive Day)
- Day 5: Midpoint = ($60 + $52) / 2 = $56, Closing Price = $58 (Positive Day)
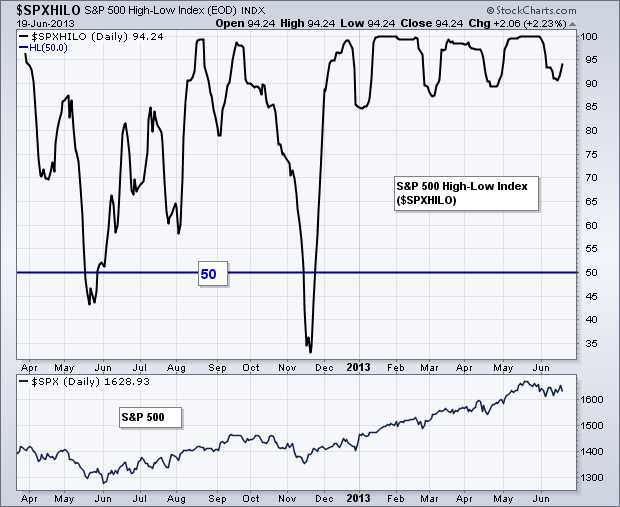
High-Low Index Chart
The High-Low Index is a technical analysis tool that can be used to identify market trends and potential reversals. It is calculated by dividing the number of new highs by the sum of new highs and new lows over a certain period of time. The resulting value is then multiplied by 100 to give a percentage.
The High-Low Index chart displays the calculated values over a specific time period. It typically consists of a line graph that shows the fluctuations of the index over time. The x-axis represents the time period, while the y-axis represents the value of the index. The chart may also include additional indicators or overlays to provide further analysis.
The High-Low Index chart can be used in various ways to analyze market trends. When the index is above a certain threshold, it may indicate a bullish market, suggesting that there are more new highs than new lows. Conversely, when the index is below a certain threshold, it may indicate a bearish market, suggesting that there are more new lows than new highs.
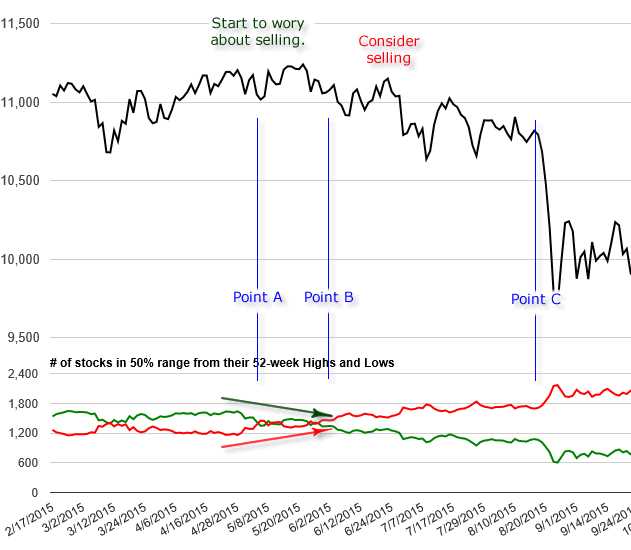
Traders and investors can use the High-Low Index chart to identify potential buying or selling opportunities. For example, when the index is in an uptrend and reaches an extreme high level, it may suggest that the market is overbought and due for a correction. Conversely, when the index is in a downtrend and reaches an extreme low level, it may suggest that the market is oversold and due for a rebound.
Example of High-Low Index Chart
Let’s consider an example to better understand how the High-Low Index chart works. Suppose we calculate the index over a 20-day period and obtain the following values:
| Date | New Highs | New Lows | High-Low Index |
|---|---|---|---|
| Day 1 | 100 | 50 | 66.7% |
| Day 2 | 80 | 70 | 53.3% |
| Day 3 | 120 | 40 | 75% |
| Day 4 | 90 | 60 | 60% |
| Day 5 | 110 | 30 | 78.6% |

Emily Bibb simplifies finance through bestselling books and articles, bridging complex concepts for everyday understanding. Engaging audiences via social media, she shares insights for financial success. Active in seminars and philanthropy, Bibb aims to create a more financially informed society, driven by her passion for empowering others.