
Cup and Handle Pattern Trading: Tips and Example

The cup and handle pattern is a popular technical analysis concept used by traders to identify potential trend reversals and continuation patterns. It is considered a bullish pattern and is often seen as a sign of a potential upward price movement.
The pattern gets its name from its shape, which resembles a cup with a handle. The cup portion of the pattern is formed when the price of an asset experiences a gradual decline followed by a gradual increase, creating a rounded bottom. The handle portion is formed when the price consolidates in a narrow range after the cup formation.
Traders look for the cup and handle pattern as it can provide valuable information about the future price movement of an asset. When the pattern is identified, traders can use it to determine potential entry and exit points for their trades.
Here are some tips for trading the cup and handle pattern:
1. Confirm the Pattern: Before making any trading decisions, it is important to confirm that the pattern is indeed a cup and handle pattern. Look for the characteristic shape and ensure that the price action fits the pattern’s criteria.
2. Volume Confirmation: Volume can provide additional confirmation for the pattern. Ideally, the volume should be higher during the cup formation and decrease during the handle formation. This indicates that there is strong buying interest during the cup formation and a decrease in selling pressure during the handle formation.
3. Entry and Exit Points: Once the pattern is confirmed, traders can determine their entry and exit points. The entry point is usually at the breakout of the handle formation, while the exit point can be set at a predetermined target or based on other technical indicators.
4. Risk Management: As with any trading strategy, risk management is crucial. Set stop-loss orders to limit potential losses and consider the risk-reward ratio before entering a trade.
Let’s take a look at an example to better understand how to trade the cup and handle pattern:
Example:
Suppose you are analyzing the price chart of a stock and notice a cup and handle pattern forming. The cup formation shows a gradual decline in price followed by a gradual increase, forming a rounded bottom. The handle formation shows a consolidation in a narrow range.
You confirm the pattern by checking the volume, which is higher during the cup formation and decreases during the handle formation. This indicates a strong buying interest during the cup formation and a decrease in selling pressure during the handle formation.
You decide to enter a long trade at the breakout of the handle formation, setting your stop-loss order just below the handle’s low. You also set a target price based on your analysis of the chart and other technical indicators.
If the price reaches your target, you exit the trade and take your profits. However, if the price hits your stop-loss order, you exit the trade with a limited loss.
By following these tips and using the cup and handle pattern as a trading strategy, you can potentially identify profitable trading opportunities and improve your trading performance.
The cup and handle pattern is a bullish continuation pattern that is commonly used in technical analysis to identify potential buying opportunities in the financial markets. It is named after its shape, which resembles a cup with a handle on the right side.
The pattern is formed when the price of an asset experiences a gradual and rounded bottom followed by a short consolidation period, creating the shape of a cup. This cup formation is a sign of a temporary pause in the downtrend or a period of accumulation by buyers.
After the cup formation, the price typically experiences a small pullback, forming a handle on the right side of the cup. The handle is characterized by a slight downward slope and lower trading volume compared to the cup formation.
The cup and handle pattern is considered to be a bullish continuation pattern because it suggests that the price is likely to continue its upward trend after the consolidation period. Traders and investors often look for this pattern as a signal to enter a long position or add to an existing position.
When analyzing the cup and handle pattern, it is important to consider the following key points:
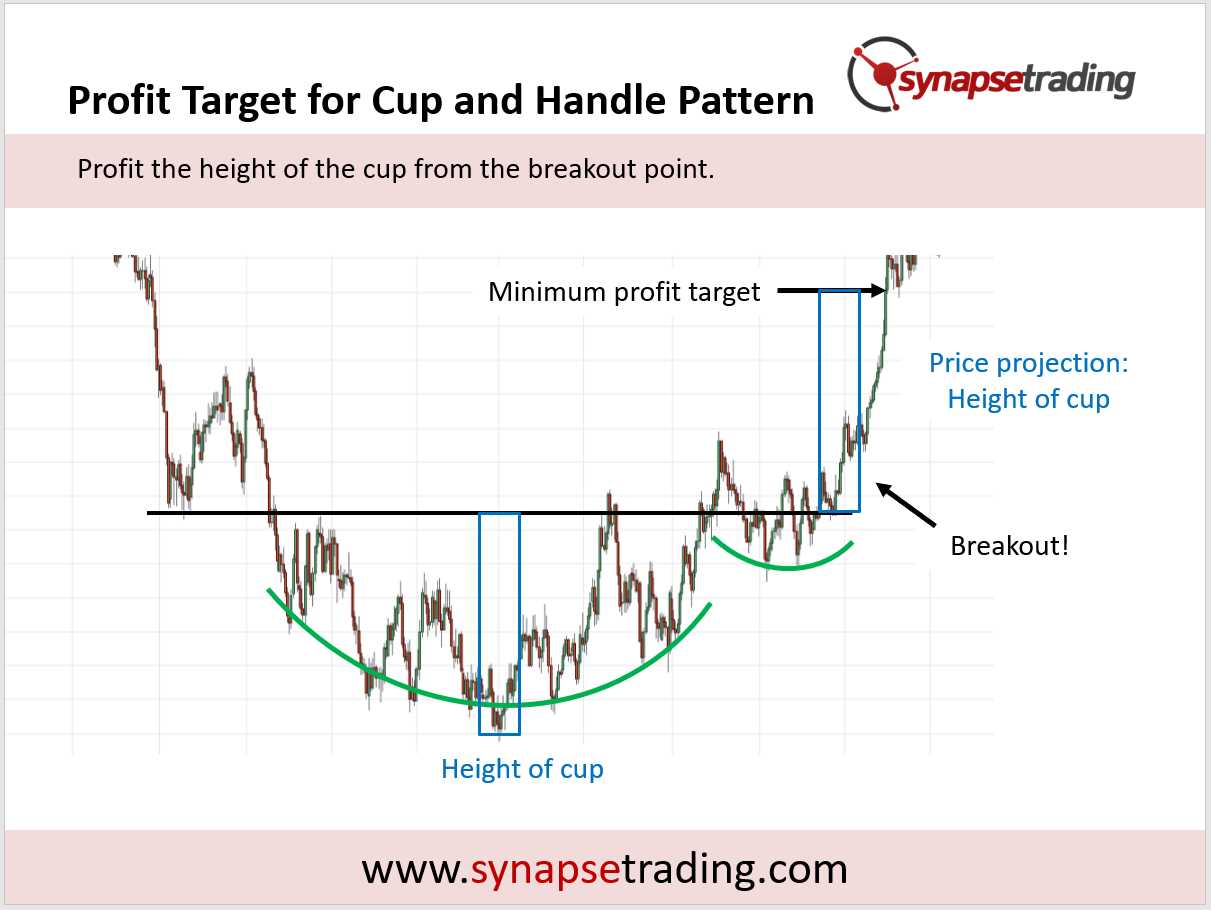
1. Cup Depth: The depth of the cup is an important factor to consider. A deeper cup indicates a stronger bullish trend, while a shallow cup may suggest a weaker trend.
2. Handle Length: The length of the handle is also significant. A shorter handle indicates a stronger pattern, while a longer handle may suggest a weaker pattern.
3. Volume: Volume analysis is crucial when identifying the cup and handle pattern. The volume should be higher during the cup formation and lower during the handle formation.
4. Breakout Confirmation: To confirm the validity of the pattern, traders often wait for a breakout above the resistance level formed by the handle. This breakout should be accompanied by a significant increase in volume.
Trading Strategies for the Cup and Handle Pattern
1. Breakout Strategy: One common strategy when trading the cup and handle pattern is to wait for a breakout. Traders can enter a long position when the price breaks above the handle resistance level. This breakout can indicate a potential upward trend and can be a signal to buy.
2. Confirmation Strategy: Another strategy is to wait for confirmation before entering a trade. Traders can look for additional technical indicators or patterns to confirm the cup and handle pattern. For example, they can look for a bullish divergence on the RSI or a bullish candlestick pattern to confirm the potential trend reversal.
3. Volume Analysis: Volume analysis can also be used when trading the cup and handle pattern. Traders can look for an increase in volume during the breakout or confirmation of the pattern. High volume can indicate strong buying pressure and can provide further confirmation of the potential trend reversal or continuation.
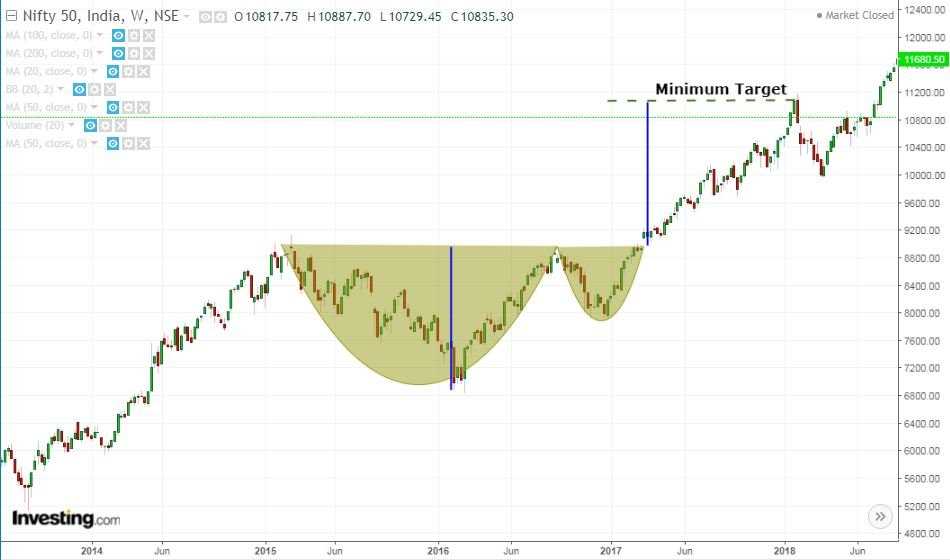
4. Stop Loss and Take Profit: It is important to set proper stop loss and take profit levels when trading the cup and handle pattern. Traders can set their stop loss below the handle support level to limit their losses if the pattern fails. They can also set their take profit level based on the height of the cup pattern or use a trailing stop to maximize their profits.
5. Risk Management: As with any trading strategy, risk management is crucial when trading the cup and handle pattern. Traders should only risk a small percentage of their trading capital on each trade and should have a clear plan in place for managing their risk. They should also be prepared to exit the trade if the pattern fails or if the market conditions change.
| Trading Strategy | Description |
|---|---|
| Breakout Strategy | Wait for a breakout above the handle resistance level to enter a long position. |
| Confirmation Strategy | Look for additional technical indicators or patterns to confirm the cup and handle pattern. |
| Volume Analysis | Use volume analysis to confirm the breakout or confirmation of the pattern. |
| Stop Loss and Take Profit | Set proper stop loss and take profit levels to limit losses and maximize profits. |
| Risk Management | Manage risk by only risking a small percentage of trading capital and having a clear plan in place. |
These are just a few trading strategies that can be used when trading the cup and handle pattern. It is important to note that no trading strategy is foolproof and traders should always do their own research and analysis before making any trading decisions. Additionally, it is recommended to practice these strategies on a demo account before trading with real money.
Real-Life Example of Cup and Handle Pattern Trading
One of the most well-known and widely used chart patterns in technical analysis is the cup and handle pattern. This pattern is often seen as a bullish continuation pattern, indicating a potential upward trend in the price of an asset. Let’s take a look at a real-life example of how the cup and handle pattern can be used in trading.
Company XYZ
Let’s say we are analyzing the stock of Company XYZ, a technology company that has been experiencing steady growth over the past few years. After conducting a thorough analysis of the stock’s price history, we notice the formation of a cup and handle pattern.
The cup and handle pattern consists of two main parts: the cup and the handle. The cup is a rounded bottom formation, resembling a “U” shape, and represents a period of consolidation or a temporary pause in the upward trend. The handle is a smaller, downward-sloping price movement that follows the cup formation.
In the case of Company XYZ, we can see that the stock price initially formed a cup pattern, with the price reaching a high point and then pulling back to form the bottom of the cup. This consolidation period indicates that the stock has found support and is preparing for a potential breakout.
After the cup formation, the stock price starts to form the handle. The handle is characterized by a slight downward movement in price, usually on lower trading volume. This downward movement represents a final shakeout of weak hands before the stock resumes its upward trend.
Once the handle formation is complete, the stock price typically breaks out above the resistance level formed by the top of the cup. This breakout is often accompanied by an increase in trading volume, indicating strong buying pressure. Traders who recognize this pattern may enter a long position at this point, expecting the stock price to continue its upward trend.
In the case of Company XYZ, after the breakout above the resistance level, the stock price starts to rally, confirming the validity of the cup and handle pattern. Traders who entered a long position at the breakout point can now ride the upward trend and potentially profit from the price increase.

Emily Bibb simplifies finance through bestselling books and articles, bridging complex concepts for everyday understanding. Engaging audiences via social media, she shares insights for financial success. Active in seminars and philanthropy, Bibb aims to create a more financially informed society, driven by her passion for empowering others.