
Covariance: Formula, Definition, Types, and Examples
Formula
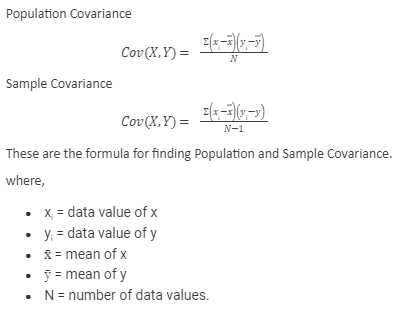
The formula for covariance is:
Where:
- cov(X, Y) is the covariance between variables X and Y
- Σ represents the sum of
- X and Y are the values of the variables
- μX and μY are the means of variables X and Y, respectively
- n is the number of data points
Definition
Covariance measures the directional relationship between two variables. A positive covariance indicates a positive linear relationship, meaning that as one variable increases, the other variable tends to increase as well. A negative covariance indicates a negative linear relationship, meaning that as one variable increases, the other variable tends to decrease.
Types of Covariance
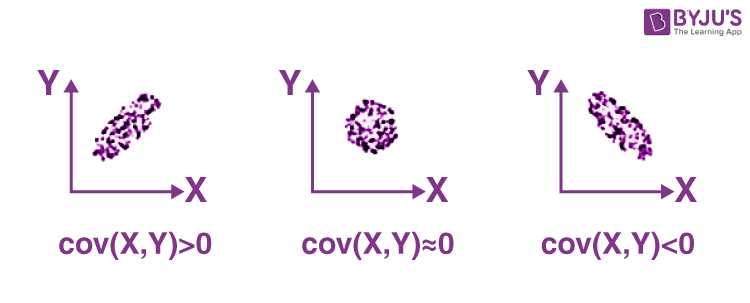
There are three types of covariance:
- Positive Covariance: When the covariance is positive, it indicates a positive relationship between the variables. This means that the variables tend to move in the same direction.
- Negative Covariance: When the covariance is negative, it indicates a negative relationship between the variables. This means that the variables tend to move in opposite directions.
- Zero Covariance: When the covariance is zero, it indicates no linear relationship between the variables. This means that the variables are independent of each other.
Examples of Covariance
Let’s consider an example to illustrate covariance. Suppose we have data on the monthly returns of two stocks, Stock X and Stock Y, over a period of one year. By calculating the covariance between the monthly returns of the two stocks, we can determine the relationship between their performances. If the covariance is positive, it suggests that the stocks tend to move in the same direction. If the covariance is negative, it suggests that the stocks tend to move in opposite directions.
Covariance Formula
Covariance is a statistical measure that quantifies the relationship between two random variables. It is used to determine how changes in one variable are related to changes in another variable. The covariance formula allows us to calculate this measure of relationship.
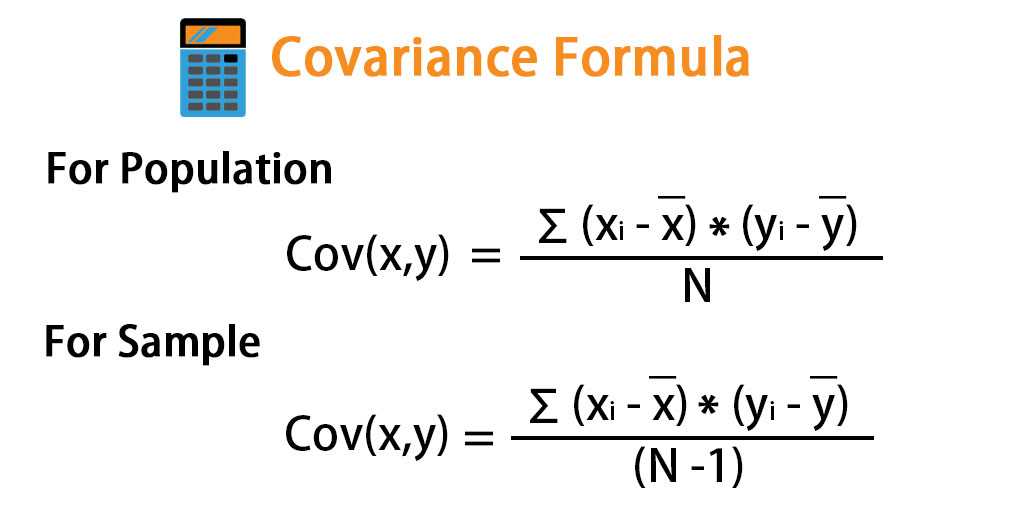
The covariance formula is as follows:
Where:
- Cov(X, Y) represents the covariance between variables X and Y.
- Σ denotes the summation symbol, indicating that we need to sum up the values for each observation.
- X and Y are the random variables for which we want to calculate the covariance.
- μX and μY represent the means of variables X and Y, respectively.
- n is the number of observations.
Interpreting Covariance
The covariance value can be positive, negative, or zero, indicating different types of relationships between the variables:
- A positive covariance suggests a direct relationship, meaning that as one variable increases, the other variable tends to increase as well.
- A negative covariance suggests an inverse relationship, meaning that as one variable increases, the other variable tends to decrease.
- A covariance of zero suggests no linear relationship between the variables.
However, it is important to note that covariance alone does not provide information about the strength or magnitude of the relationship between variables. To measure the strength of the relationship, we need to use the concept of correlation.
Using Covariance in Portfolio Management
In the context of portfolio management, covariance is a crucial measure. It helps investors assess the diversification benefits of combining different assets in a portfolio. A low or negative covariance between assets indicates that they are likely to move independently of each other, reducing the overall risk of the portfolio.
By calculating the covariance between various assets, investors can construct portfolios that optimize risk and return. They can select assets that have low or negative covariance, as this can potentially lead to better risk-adjusted returns.
Overall, the covariance formula is a valuable tool in statistics and finance. It allows us to quantify the relationship between variables and make informed decisions in various fields, including portfolio management.
Definition of Covariance
Covariance is a statistical measure that quantifies the relationship between two random variables. It is used to determine how changes in one variable are related to changes in another variable. In other words, covariance measures the degree to which two variables move together.
Formula
The formula for covariance between two variables X and Y is:
Where:
- cov(X, Y) is the covariance between X and Y
- X and Y are the values of the two variables
- μX and μY are the means of X and Y, respectively
- n is the number of data points
Interpretation
The sign of the covariance indicates the direction of the relationship between the variables. A positive covariance indicates a positive relationship, meaning that as one variable increases, the other variable tends to increase as well. A negative covariance indicates a negative relationship, meaning that as one variable increases, the other variable tends to decrease.
The magnitude of the covariance indicates the strength of the relationship. A larger covariance value indicates a stronger relationship, while a smaller covariance value indicates a weaker relationship.
Limitations
It is important to note that covariance does not provide information about the scale of the variables or the strength of the relationship in a standardized way. Therefore, it can be difficult to compare covariances between different pairs of variables.
In addition, covariance can be influenced by outliers in the data, which can distort the results. It is important to be cautious when interpreting covariance values and consider other statistical measures, such as correlation, for a more comprehensive analysis of the relationship between variables.
Types of Covariance
Covariance is a statistical measure that quantifies the relationship between two random variables. There are several types of covariance that are commonly used in statistical analysis:
1. Positive Covariance: Positive covariance occurs when the values of two variables tend to move in the same direction. In other words, when one variable increases, the other variable also tends to increase. This indicates a positive relationship between the variables.
2. Negative Covariance: Negative covariance occurs when the values of two variables tend to move in opposite directions. In other words, when one variable increases, the other variable tends to decrease. This indicates a negative relationship between the variables.
3. Zero Covariance: Zero covariance occurs when there is no linear relationship between the variables. This means that the values of one variable do not change systematically with the values of the other variable.
4. High Covariance: High covariance occurs when the values of two variables vary greatly from their means. This indicates a strong relationship between the variables, where changes in one variable are likely to be accompanied by large changes in the other variable.
5. Low Covariance: Low covariance occurs when the values of two variables vary less from their means. This indicates a weak relationship between the variables, where changes in one variable are less likely to be accompanied by large changes in the other variable.
Examples of Covariance
-
Example 1: Let’s consider two stocks, Stock A and Stock B. We want to analyze the relationship between the daily returns of these stocks over a period of time. By calculating the covariance between the daily returns of Stock A and Stock B, we can determine whether they move in the same direction or opposite directions. A positive covariance indicates that the stocks move together, while a negative covariance suggests that they move in opposite directions.
-
Example 2: Suppose we have a dataset that contains the heights and weights of a group of individuals. We can calculate the covariance between height and weight to understand the relationship between these two variables. A positive covariance would indicate that taller individuals tend to have higher weights, while a negative covariance would suggest the opposite.
-
Example 3: Let’s say we are analyzing the relationship between the number of hours studied and the exam scores of a group of students. By calculating the covariance between these two variables, we can determine whether there is a positive relationship between studying more hours and achieving higher exam scores. A positive covariance would indicate that students who study more tend to perform better on exams.
-
Example 4: Consider a portfolio of investments that includes stocks, bonds, and real estate. We can calculate the covariance between the returns of each asset to understand how they move together. A positive covariance between stocks and bonds would suggest that they tend to move in the same direction, while a negative covariance between stocks and real estate would indicate that they move in opposite directions.
These examples demonstrate how covariance can be used to analyze the relationship between different variables in various contexts. By calculating covariance, we can gain insights into the direction and strength of the relationship between variables, which can be valuable in making informed decisions in fields such as finance, economics, and social sciences.

Emily Bibb simplifies finance through bestselling books and articles, bridging complex concepts for everyday understanding. Engaging audiences via social media, she shares insights for financial success. Active in seminars and philanthropy, Bibb aims to create a more financially informed society, driven by her passion for empowering others.