
Bearish Engulfing Pattern: Learn How to Identify and Trade This Reversal Signal
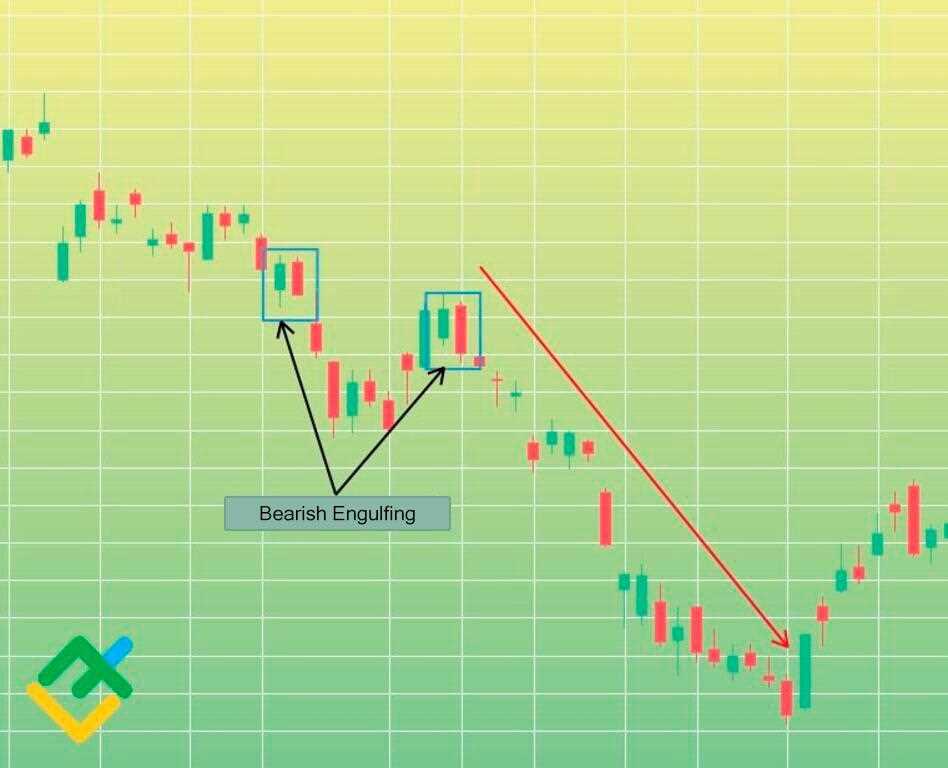
The bearish engulfing pattern is a powerful reversal signal that can be used by traders to identify potential trend reversals in the financial markets. This pattern is formed when a small bullish candle is followed by a larger bearish candle that completely engulfs the previous candle’s body.
Traders can use the bearish engulfing pattern to enter short positions or to exit long positions, as it indicates a shift in market sentiment from bullish to bearish. This pattern is particularly effective when it occurs after a prolonged uptrend, as it suggests that the bulls are losing control and the bears are taking over.
To better understand the bearish engulfing pattern, let’s break it down into its components. The pattern consists of two candles: a small bullish candle and a larger bearish candle. The bullish candle represents a period of buying pressure, while the bearish candle represents a period of selling pressure.
What makes the bearish engulfing pattern significant is that the bearish candle completely engulfs the previous candle’s body. This means that the bearish candle opens above the previous candle’s high and closes below its low, indicating a strong shift in market sentiment.
Identifying the Bearish Engulfing Pattern
To identify the bearish engulfing pattern, traders should look for the following criteria:
- A small bullish candle that represents a period of buying pressure.
- A larger bearish candle that completely engulfs the previous candle’s body.
- The bearish candle opens above the previous candle’s high and closes below its low.
Trading Strategies for the Bearish Engulfing Pattern

There are several trading strategies that traders can use when they spot a bearish engulfing pattern:
- Short Entry: Traders can enter a short position when the bearish engulfing pattern occurs after a prolonged uptrend. They can place a stop loss above the high of the bearish candle and target the previous support levels.
- Exit Long Position: Traders who are already in a long position can use the bearish engulfing pattern as a signal to exit their positions. They can place a stop loss below the low of the bearish candle and look for other opportunities to enter short positions.
Risk Management and Stop Loss Placement
As with any trading strategy, risk management is crucial when trading the bearish engulfing pattern. Traders should always use stop loss orders to limit their potential losses in case the trade goes against them.
When trading the bearish engulfing pattern, traders can place their stop loss orders above the high of the bearish candle. This allows for a tight stop loss placement and reduces the risk of the trade.
Examples of Bearish Engulfing Patterns in Real Market Situations

Let’s take a look at a couple of examples of bearish engulfing patterns in real market situations:
Example 1: In the daily chart of XYZ stock, there is a prolonged uptrend followed by a bearish engulfing pattern. Traders who spotted this pattern could have entered a short position and placed a stop loss above the high of the bearish candle. The price then dropped significantly, confirming the validity of the pattern.
Example 2: In the weekly chart of ABC currency pair, there is a bearish engulfing pattern after a period of consolidation. Traders who spotted this pattern could have exited their long positions and looked for other opportunities to enter short positions. The price then declined, indicating a successful trade.
The bearish engulfing pattern is a powerful reversal signal that can indicate a potential change in the direction of a trend. It is formed when a small bullish candle is followed by a larger bearish candle that completely engulfs the previous candle.
This pattern suggests that the bears have taken control of the market and are likely to push prices lower. It is considered a bearish signal because it shows that the sellers have overwhelmed the buyers and are now driving the price down.
How to Identify the Bearish Engulfing Pattern

To identify the bearish engulfing pattern, look for the following characteristics:
- A small bullish candlestick that is followed by a larger bearish candlestick.
- The bearish candlestick should completely engulf the previous bullish candlestick.
- The bearish candlestick should have a long body, indicating strong selling pressure.
It is important to note that the bearish engulfing pattern is more reliable when it occurs after an uptrend, as it indicates a potential reversal in the upward movement.
Trading Strategies for the Bearish Engulfing Pattern
There are several trading strategies that can be used with the bearish engulfing pattern:
- Short Selling: Traders can take a short position when the bearish engulfing pattern occurs after an uptrend. They can place a stop loss above the high of the bearish candlestick and target the next support level.
- Put Options: Options traders can buy put options when the bearish engulfing pattern occurs. This allows them to profit from a potential decline in the underlying asset.
- Confirmation: Some traders prefer to wait for confirmation before entering a trade. They may look for additional bearish signals or use technical indicators to confirm the reversal.
It is important to practice proper risk management when trading the bearish engulfing pattern. Traders should always use stop losses to limit their losses in case the trade goes against them.
Examples of Bearish Engulfing Patterns in Real Market Situations
Here are a few examples of bearish engulfing patterns in real market situations:
- On a daily chart of XYZ stock, a small bullish candle is followed by a large bearish candle that completely engulfs the previous candle. This indicates a potential reversal in the upward movement of the stock.
- On a weekly chart of ABC currency pair, a small bullish candle is followed by a bearish candle with a long body that engulfs the previous candle. This suggests that the bears have taken control and the price may continue to decline.
These examples demonstrate how the bearish engulfing pattern can be used to identify potential reversals and make profitable trading decisions.
Identifying the Bearish Engulfing Pattern
The bearish engulfing pattern is a popular candlestick pattern used in technical analysis to identify potential reversals in the market. It consists of two candles, with the first candle being a smaller bullish candle and the second candle being a larger bearish candle that completely engulfs the previous candle.
To identify the bearish engulfing pattern, look for the following characteristics:
- The first candle should be a small bullish candle, indicating that buyers are still in control.
- The second candle should be a larger bearish candle, indicating that sellers have taken control and are overpowering the buyers.
- The second candle should completely engulf the body of the first candle, meaning that the high and low of the second candle should be higher and lower, respectively, than the high and low of the first candle.
By identifying the bearish engulfing pattern, traders can anticipate potential reversals in the market and adjust their trading strategies accordingly. This pattern can be found in various timeframes and markets, making it a versatile tool for technical analysis.
Trading Strategies for the Bearish Engulfing Pattern
The bearish engulfing pattern is a powerful reversal signal that can provide traders with profitable trading opportunities. Here are some trading strategies that can be used when identifying and trading the bearish engulfing pattern:
| Strategy | Description |
|---|---|
| 1. Short Entry Strategy | When a bearish engulfing pattern is identified, traders can enter a short position at the close of the bearish candle. This strategy assumes that the bearish engulfing pattern signals a reversal of the previous uptrend and a potential downtrend. |
| 2. Stop Loss Placement | To manage risk, traders should place a stop loss order above the high of the bearish engulfing candle. This will help protect against potential losses if the market reverses and moves against the trade. |
| 3. Take Profit Target | Traders can set a take profit target by measuring the height of the bearish engulfing candle and projecting it downwards from the entry point. This can provide a potential profit target for the trade. |
| 4. Confirmation Signals | Traders can look for additional confirmation signals to strengthen the validity of the bearish engulfing pattern. This can include indicators such as moving averages, trend lines, or other technical analysis tools. |
| 5. Risk Management | It is important to manage risk when trading the bearish engulfing pattern. This can be done by using proper position sizing, setting stop loss orders, and not risking more than a certain percentage of the trading account on any single trade. |
By using these trading strategies, traders can take advantage of the bearish engulfing pattern and potentially profit from market reversals. However, it is important to note that no trading strategy is guaranteed to be successful, and traders should always perform their own analysis and risk management before entering any trades.
Risk Management and Stop Loss Placement
When trading the bearish engulfing pattern, it is crucial to implement proper risk management techniques to protect your capital. One of the most important aspects of risk management is determining where to place your stop loss.
The stop loss is an order placed with your broker to automatically exit a trade if the price reaches a certain level. It is designed to limit your losses and protect your capital in case the trade goes against you.
When trading the bearish engulfing pattern, the stop loss should be placed above the high of the engulfing candle. This level represents the point at which the bullish momentum has overcome the bearish momentum, indicating a potential reversal in the market.
Placing the stop loss above the high of the engulfing candle ensures that you exit the trade if the price continues to rise, indicating that the bearish reversal signal was invalid.
It is important to note that the placement of the stop loss should be based on the individual trader’s risk tolerance and trading strategy. Some traders may choose to place the stop loss at a higher level to give the trade more room to breathe, while others may opt for a tighter stop loss to limit potential losses.
In addition to stop loss placement, it is also important to consider position sizing and risk-reward ratio when managing risk. Position sizing refers to the number of shares or contracts you trade, while risk-reward ratio refers to the potential profit compared to the potential loss.
By implementing proper risk management techniques, such as stop loss placement, position sizing, and risk-reward ratio analysis, traders can minimize their losses and increase their chances of success when trading the bearish engulfing pattern.
| Key Points |
|---|
| – Place the stop loss above the high of the engulfing candle |
| – Consider individual risk tolerance and trading strategy |
| – Implement proper position sizing and risk-reward ratio analysis |
Examples of Bearish Engulfing Patterns in Real Market Situations
Example 1: Stock Market
Let’s say you are analyzing a stock chart and notice a bearish engulfing pattern forming. The previous candle is bullish, indicating an upward trend, while the current candle is bearish and completely engulfs the previous one. This signals a potential reversal of the upward trend and a possible shift towards a downtrend.
As a trader, you might interpret this as a signal to sell or short the stock, anticipating a price decline. You could set a stop-loss order above the bearish engulfing pattern to limit potential losses if the market moves against your trade.
Example 2: Forex Market
In the forex market, bearish engulfing patterns can also be observed. Let’s say you are analyzing the EUR/USD currency pair and notice a bearish engulfing pattern on the daily chart. The previous candle is bullish, indicating an upward trend, while the current candle is bearish and engulfs the previous one.
This could be interpreted as a potential reversal of the upward trend and a possible shift towards a downtrend in the EUR/USD pair. As a forex trader, you might consider selling the pair or entering a short position, expecting a decline in the exchange rate.
Example 3: Cryptocurrency Market
Bearish engulfing patterns can also be found in the cryptocurrency market. For example, let’s say you are analyzing the Bitcoin (BTC) chart and notice a bearish engulfing pattern on the hourly timeframe. The previous candle is bullish, indicating an upward trend, while the current candle is bearish and completely engulfs the previous one.
This could be seen as a potential reversal signal, suggesting a shift from the upward trend to a possible downtrend in Bitcoin. As a cryptocurrency trader, you might consider selling Bitcoin or entering a short position, anticipating a price decline.

Emily Bibb simplifies finance through bestselling books and articles, bridging complex concepts for everyday understanding. Engaging audiences via social media, she shares insights for financial success. Active in seminars and philanthropy, Bibb aims to create a more financially informed society, driven by her passion for empowering others.